Apple Reports Thursday: What the Options Market Is Pricing
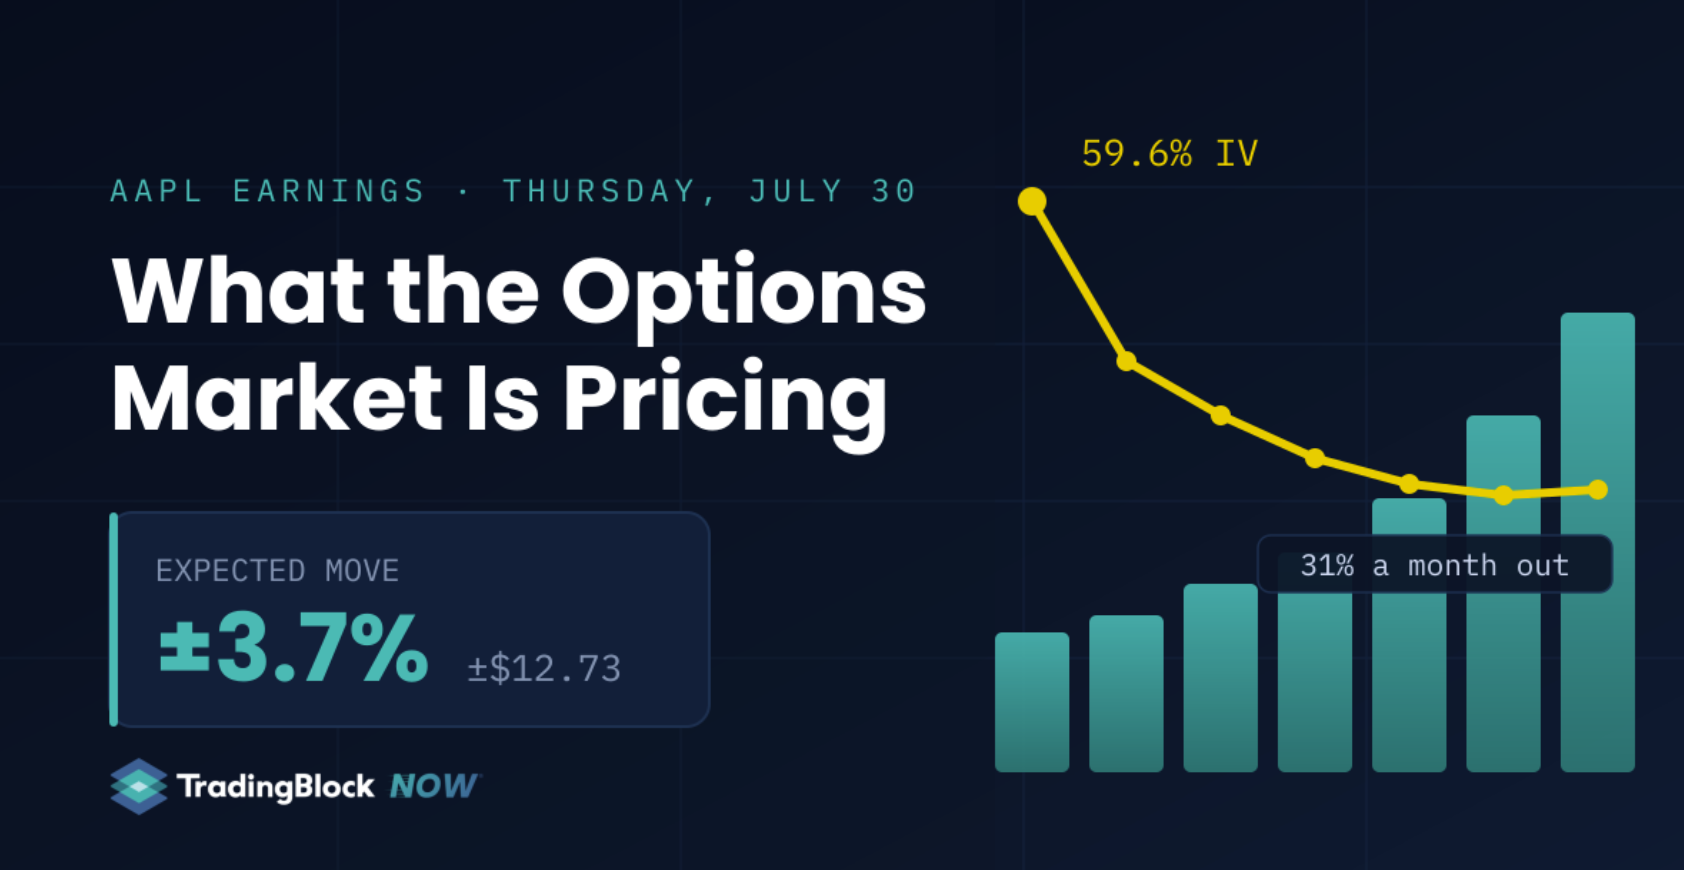
The options market prices a move of about ±$13, or 3.7%, through Apple's report Thursday night. Implied volatility sits in the 64th percentile of its year, the board leans toward calls in both open interest and volume, and the curve behind the event is nearly flat.

At a Glance
- Apple reports Thursday, July 30, after the close. The July 31 expiration prices a ±$12.73 move, about 3.7%.
- Implied volatility runs 59.58% for Friday's expiration and 30.87% a month out, a front-week premium that typically drains after the report.
- Open interest leans toward calls, 2.7 million against 2.1 million, and nearly 60% of Wednesday's put volume traded at 0 to 20 delta.
Apple (NASDAQ: AAPL) reports earnings Thursday, July 30, after the close. Open interest, the count of contracts currently held open across all expirations, stands near 2.7 million calls against 2.1 million puts, and the July 31 expiration prices a move of about ±$12.73, or 3.7%, through the report. Wednesday's volume tilts the same way, about four calls for every three puts, with put activity picking up through the afternoon.
Volatility Is Elevated, Not Stretched
Implied volatility is the market's forecast of future movement, backed out from what traders are paying for options. Apple's sits near 31.4%, in the 64th percentile of its 52-week range of roughly 19.5% to 38.1%. Elevated, short of extreme. Realized volatility, the movement the stock has actually delivered, sits in its 60th percentile, so options are pricing only a modest step up from what Apple has already been doing. How that premium is spread across expirations tells you more.
AAPL Implied Volatility and Expected Move by Expiration
Expected move in dollars (bars) and implied volatility (line) · Wednesday afternoon · July 29, 2026
| Expiration | Days | Implied vol | Expected move |
|---|---|---|---|
| 31 JUL 26 | 2 | 59.58% | ±$12.73 |
| 3 AUG 26 | 5 | 42.68% | ±$13.95 |
| 7 AUG 26 | 9 | 38.19% | ±$16.59 |
| 14 AUG 26 | 16 | 34.20% | ±$19.70 |
| 21 AUG 26 | 23 | 32.10% | ±$22.13 |
| 28 AUG 26 | 30 | 30.87% | ±$24.29 |
| 18 SEP 26 | 51 | 30.32% | ±$31.10 |
| 16 OCT 26 | 79 | 30.19% | ±$38.60 |
| 15 JAN 27 | 170 | 31.24% | ±$59.13 |
Source: intraday options data as of Wednesday afternoon, July 29, 2026. Implied volatility falls from 59.58% at the July 31 expiration to 30.87% a month out, then flattens.
A Flat Curve Behind the Event
The expected move is the swing, up or down, that option prices imply for a given expiration, roughly what an at the money straddle costs. Wednesday's expiration goes off the board before Thursday night's report and there is no Thursday weekly, so Friday's July 31 expiration is the first one that catches the news. It prices ±$12.73, and the premium behind it drains fast: 59.58% implied volatility for Friday, 42.68% by Monday, 30.87% a month out. From there the curve barely moves through December 2028. A month out and beyond, the market treats Apple as the same stock before and after the print.
Where the Positioning Sits
Open interest tells the longer story. Call open interest clusters at and just above the current share price near $340. Put open interest spreads across strikes below the market. A call-heavy board is not by itself a bullish vote, since covered calls, spreads, and hedges all add to call open interest. Wednesday's flow matches. Delta measures how much an option moves when the stock moves, and by extension how far from the money it sits. Nearly 60% of put volume is trading at 0 to 20 delta, cheap strikes that trade as pre-earnings insurance. Call volume is far more distributed, with about a third at 21 to 40 delta and a quarter at 41 to 60. Trade location adds a timing note. Put volume printed heavily at the bid in the morning, consistent with put selling, and that tilt has evened out as the session progressed.
The setup into the report: implied volatility in the upper third of its year, a flat curve behind the event, calls in the majority on both the open interest and volume side, and a put market dominated by cheap protection. Whatever Apple reports, the front expirations will reprice within minutes. For a closer look at how that premium builds and drains around earnings, see our guide to implied versus realized volatility.
Four Structures That Fit the Data
These four come from our option strategies library, each tied to the data above. They are illustrations of how traders can express different views with the same data, not recommendations of one structure over another. Strikes reference Friday's July 31 event expiration and its ±$12.73 expected move, a priced range near $329 to $354. The front week is where the earnings premium concentrates and drains, and where options move fastest; the same structures work further out for a calmer ride. Deltas and prices are midpoints from Wednesday afternoon's board and will move into the report. Every structure here includes a short option, and a short option that finishes in the money can be assigned, meaning you are obligated to buy or deliver the shares. The premium you actually pay or collect is the deciding input, and delta is often used as a rough approximation of the odds an option finishes in the money.
- Bull call spread. The board's call tilt with defined risk. Buy the 345 call at about 37 delta, sell the 355 at about 16. Net position runs roughly 21 delta and the debit is the most you can lose. Near $2.60 at Wednesday's mids on a spread worth up to $10, so risking about $260 for a max payout around $740. About one in six odds at the max payout; any profit depends on the debit paid.
- Short put. The 330 put, bottom of the priced range, trades near $2.45 at about 26 delta. Selling it cash-secured collects the premium the insurance buyers are paying and obligates you to buy shares at 330 if assigned. Roughly 75% odds it expires out of the money at Wednesday's pricing. The tradeoff is a small win most of the time against a large loss if the stock falls hard. Our guide to selling calls and puts covers the risk side in detail.
- Short iron condor. The direct bet on the front-week premium. Sell the 330 put and 355 call at the range edges, buy the 320 put and 365 call as wings. Collects near $2.55 against $10 wide wings, about $255 taken in versus $745 at risk. Near delta neutral, defined both sides, profits if Apple lands inside the range while Friday's 59% implied volatility resets. Roughly 60% odds at Wednesday's pricing.
- Collar. For shareholders through the print. Against 100 shares, buy the 330 put and sell the 355 call; the call covers about half the put for a net debit near $1.25. Floor at 330, cap at 355, and net delta drops from 100 to roughly 60.
Payoff Shapes at the July 31 Expiration
P/L at expiration by stock price · shaded band = ±$12.73 expected move ($329 to $354) · yellow dash = current price · grey dash = zero P/L · shapes illustrative, not to scale
Bull Call Spread
Long 345 call, short 355 call. Loss capped at the debit. About 1 in 6 odds of the max payout.
Short Put
Cash-secured 330 put, about 26 delta. Full premium kept above the strike, roughly 75% of the time. Losses grow below it.
Short Iron Condor
Shorts at 330 and 355, wings at 320 and 365. Roughly 60% odds Apple finishes between the shorts. Risk defined both sides.
Collar
Stock plus a 330 put, financed by a short 355 call. Floor below, cap above, full exposure in between.
Payoff shapes at expiration for the structures described above. Odds are approximations from the expected move and delta as of Wednesday, July 29, 2026.
Source: intraday options data as of Wednesday, July 29, 2026. Figures are point in time and change throughout the session. This content is for informational and educational purposes only and is not a recommendation to buy or sell any security or to use any particular strategy. Options involve substantial risk and are not suitable for all investors. Please read Characteristics and Risks of Standardized Options before trading options.
FAQ
Implied volatility (IV) is the market's expectation of how much a stock may move in the future, derived from option prices. It forecasts the size of the move, not the direction.
Implied volatility is forward-looking. It's what the market expects, backed out of an option's price. Historical volatility is backward-looking. It's what the stock actually did over a past window.
Implied volatility is backed out of an option's market price using a pricing model like Black-Scholes. It's the volatility input that makes the model match the option's actual price.
Your Weekly Options Edge
Get the options insights that matter most each week.
More from TradingBlock Now
Stay informed with the latest market insights