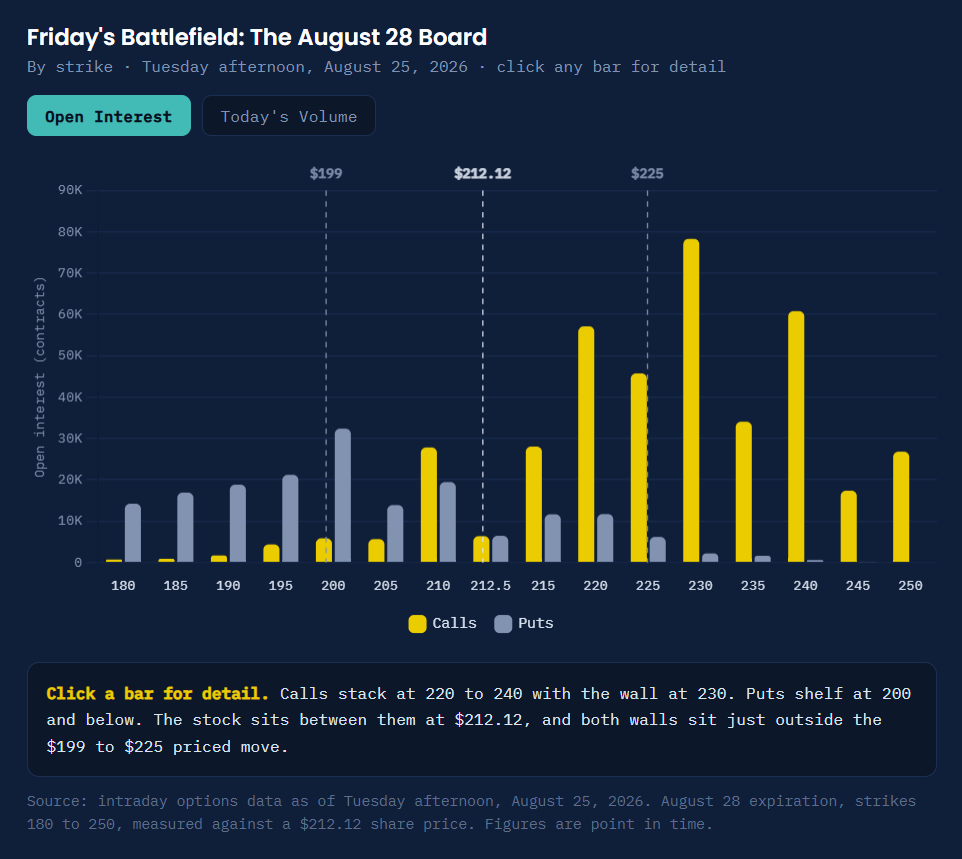
About Tradingblock now

The Options Market, Decoded.

Options news and market analysis, plus The Strike Zone, our free weekly newsletter sent straight to your inbox.

We've spent decades on the desk and in the markets, and we write like it. Our coverage tracks the news that moves positions. Our research breaks down probabilities and implied volatility into plain English you can actually use. No hot takes. Just signal from people who've traded their entire careers.

from the archive

What we've been trading.

mockup
Earnings

CRWV, NBIS, AMAT, CSCO: What Options Are Pricing Into a CPI Week

Four AI infrastructure names report between Tuesday and Thursday, and the July inflation print lands in the middle of them. Every one of those events falls inside the Friday, August 14 weekly expiration.

Implied volatility is the market's forecast for how far a stock will travel, baked into the option price. The expected move is what that forecast looks like in dollars, and it is close to what an at-the-money straddle costs. Every figure below comes off Monday morning's board.

Tuesday · August 11CoreWeave Prices A 13.6% Move

CoreWeave (NASDAQ: CRWV) reports after Tuesday's close. August 14 options carry 156.99% implied volatility and price a move of ±$12.29 against a $90.47 share price, about 13.6%. One week out that reading drops to 119.50%.

The next step down, August 21 to August 28, is only 11.7 points, and the curve flattens into the low 90s by late September and stays there. Current implied volatility sits at the 47th percentile of CoreWeave's 52-week range. TipRanks notes the stock has averaged a 16.76% absolute move on its last four reports, above what the board is pricing now.

Positioning is heavy but two-sided. Call open interest totals 1,220,347 contracts against 843,707 puts. Monday's flow leaned cautious underneath that: 21% of call volume printed at the bid or below against 13% at the ask, and 60% of put volume sat in 0 to 20 delta contracts, which reads as cheap downside cover rather than directional shorts.

TipRanks reports consensus at a loss of $1.22 per share on revenue rising about 111% to $2.55 billion. Analyst targets are scattered rather than clustered: Piper Sandler initiated Overweight at $151, Deutsche Bank's Brad Zelnick raised to $150, Wells Fargo's Michael Turrin sits at $155, and Barclays cut to $90 at Equal Weight. Consensus targets range from roughly $128 to $147 depending on which analyst set is counted.

BofA Securities analyst Tal Liani framed data center activation and power coming online as the variables that matter in a late-July preview note, with roughly 1 gigawatt active against a 1.7 gigawatt year-end target.

A meaningful acceleration in capacity deployment over the next few quarters.Tal Liani, BofA Securities, July 2026 preview note on CoreWeave's buildout pace

Where The Event Premium Sits

Each name against its own next expiration · Monday morning, August 10, 2026 · click any bar for detail

NameReportsAug 14 IVAug 21 IVAug 14 moveAug 21 move
CRWVTue PM156.99%119.50%13.6%17.0%
NBISWed AM167.41%138.91%14.5%19.8%
AMATThu PM108.37%86.51%9.3%12.2%
CSCOWed PM95.65%65.85%8.2%9.3%

Click a bar for detail. The August 14 expiration catches each company's report. August 21 catches none of them. The gap between the two is what the market charges for the event.

Source: intraday options data as of Monday morning, August 10, 2026. Expected moves measured against Monday morning share prices of $90.47 (CRWV), $191.30 (NBIS), $528.65 (AMAT) and $123.20 (CSCO). Figures are point in time.

Wednesday · August 12Three Events, One Session

Wednesday is the hinge of the week. July CPI releases at 8:30 a.m. ET, Nebius reports before the open, and Cisco reports after the close. Anyone holding either name through Wednesday is holding the macro print too.

Nebius (NASDAQ: NBIS) prices the largest percentage move of any of these reports, at 167.41% implied volatility and ±$27.75 on a $191.30 stock, about 14.5%. It falls to 138.91% the following week. TipRanks reports consensus revenue near $574 million, up more than 400% from a year ago, after a Reflection AI cloud agreement worth over $1 billion. Loss estimates are unusually scattered, running from roughly $0.53 to $0.86 per share depending on the source, which is its own signal about how little agreement there is on this quarter.

The analyst picture has split wide open going in. Piper Sandler's James Fish initiated at Neutral with a $224 target. DA Davidson's Gil Luria cut his target to $175 from $250. Michael Burry disclosed a short position. Monday's flow leaned the other way from all of that, with calls printing at the ask and put volume skewed toward the bid.

Cisco (NASDAQ: CSCO) carries the same Wednesday exposure in a much smaller number, and the number can mislead. The front week prices only ±$10.14, an 8.2% move, which looks modest until it is set against Cisco's own history: implied volatility sits at the 82nd percentile of its 52-week range, and the front week falls to 65.85% by August 21.

A small dollar move and a historically expensive option are not a contradiction. They measure different things, which is the distinction our guide to IV rank versus IV percentile exists to draw.

Cisco's tape leans call-heavy but is not one-way. Calls outran puts nearly two to one, call volume ran at more than four times its own typical pace, and 15% of it printed at the ask against 7% at the bid. The counterweight sits on the put side: 35% of put volume printed at the ask or above. Someone is paying up for downside here even as the call tape dominates the headline ratio.

Alphastreet reports consensus at $1.17 per share from 21 analysts on revenue of $16.83 billion, with a tight estimate range of $1.15 to $1.19. Management raised its fiscal-year AI infrastructure order outlook to $9 billion from $5 billion. UBS analyst David Vogt reiterated Buy with a $132 target, modeling EPS of $1.19 against the $1.17 consensus.

Thursday · August 13Applied Materials Sees Protection Bought Ahead Of The Print

Applied Materials (NASDAQ: AMAT) reports Thursday night, one session before expiration. The front week prices 108.37% implied volatility and a ±$49.35 move, roughly 9.3%, falling to 86.51% the week after.

The flow is where this board separates from its own norm. Puts ran at 1.34 times call volume, with 10% of put volume printing at the ask or above against 4% at the bid, and 71% of it sitting in 0 to 20 delta contracts. Delta approximates the odds an option finishes in the money, so a 0 to 20 delta put is a far out-of-the-money strike with a low probability of paying off, cheap per contract and typically bought as insurance rather than as a directional position.

The hedging sits on a stock that already corrected. Shares near $529 are down about 28% from a 52-week high of $739.67 set June 30. Consensus calls for $3.39 per share on revenue near $9 billion, inside management's guided range of $3.16 to $3.56 and $8.95 billion plus or minus $500 million. Targets are spread wide: Susquehanna's Mehdi Hosseini went to $900 from $575 back in late June, Wells Fargo sits at $740 at Overweight, and Morgan Stanley is at $646 at Equal Weight. MarketBeat puts the consensus near $603, though other trackers put it between $594 and $640.

Where Each Board Is Leaning

None of the below is a trade. It is what each board's own signal points toward, and the structures that tend to express that view.

  • CRWV, neutral, with a caution. A front week priced well above the rest of the curve is the classic setup for premium selling into the event, which is what a short iron condor or another defined-risk neutral structure is built for. The caution is the history: the stock has averaged a 16.76% absolute move on its last four reports, more than the board is charging now. Selling this event is a bet that this print is quieter than the recent run.
  • NBIS, bullish. The signal is the tape rather than the volatility level. Calls lifting the offer while put volume skews to the bid is a buyer-led call market, and traders who want to lean that way without paying elevated front-week premium tend to look at credit structures below the market such as a bull put spread. The offsetting risk is that it reports into CPI.
  • CSCO, neutral to slightly bullish. For a holder already long and willing to part with shares higher, the front week pays more for that commitment than Cisco's own history usually allows, which is the covered call setup. The percentile says the premium is high by Cisco's standards, not that the market is wrong, and the 35% of put volume lifting the offer argues the downside is not as quiet as the call tape suggests.
  • AMAT, hedged. The put flow points at protection rather than direction, and shareholders who share that instinct generally reach for something like a collar, financing downside cover by selling upside. Elevated call premium in the front week is what makes that financing work here.

Three Things To Watch This Week

The 8:30 print reprices before a single report is read. Nebius and Cisco both report on CPI day, so their front week carries macro risk that Tuesday's and Thursday's reports do not. That is the one exposure these names genuinely share.

A small expected move is not a cheap option. Cisco's 8.2% looks modest in dollars while sitting at the 82nd percentile of its own range. Those measure different things, and neither settles whether the premium is worth paying. The question is whether 8.2% is more or less than what Cisco actually tends to deliver on a print.

The headline ratio hides more than it shows. Applied Materials' 1.34 put-call ratio looks bearish until you see that 71% of it is in 0 to 20 delta contracts, which is hedging rather than a directional bet. Cisco runs a call-heavy ratio with 35% of its put volume lifting the offer. Our option chain explained guide covers reading volume and open interest together.

Option pricing figures reflect intraday data as of Monday morning, August 10, 2026 and change throughout the session. Expected moves are derived from option prices before each report and are not forecasts of direction. Analyst estimates and price targets are attributed to their published sources and are subject to revision. This content is for informational and educational purposes only and is not a recommendation to buy or sell any security or to use any particular strategy. Options involve substantial risk and are not suitable for all investors. Please read Characteristics and Risks of Standardized Options before trading options.

mockup
Options Trading

A Quiet VIX And The Wildest Options Week Of The Summer

Pro Takeaway

The VIX traded near 15 all week, which describes a quiet market. Individual stocks priced triple-digit implied volatility, which describes a violent one. Both readings were correct. When they separate this far, the earnings board stops being a hedge on the market and becomes its own trade.

If you only checked the fear gauge this week, you missed all of it.

The Cboe Volatility Index traded near 15 into Friday afternoon, closer to its 52-week low of 13.38 than to the 35.30 high. That number measures expected movement in the S&P 500 over the next 30 days. By that measure, nothing was happening.

Underneath it, four of the busiest boards on the market were pricing crisis-level movement. By Market Rebellion's mid-session reads early in the week, SpaceX weekly calls carried 223% implied volatility. AMD reached 179%. Snap hit 177%. Palantir printed 134%. Implied volatility is the market's forecast for how much a stock will move, baked into the option price itself. Readings like these usually show up during a selloff. This week they showed up during a record.

Here is how the five sessions actually went.

Monday · August 3Palantir Reports Into A Market That Had Given Up On It

Palantir walked into its report down 29% on the year. Investors had spent months backing away from expensive AI names, and short sellers had built roughly $2.7 billion in paper gains betting against this one.

Options priced an 11.4% move going into the report, per TipRanks' straddle math. That figure comes from the at-the-money straddle, the combined cost of a call and a put at the same strike, and it is the cleanest read on how far the market thinks a stock can travel.

The numbers landed after the bell. Revenue of $1.94 billion against $1.80 billion expected, up 93% year over year. U.S. commercial revenue up 149%. Adjusted earnings of 41 cents against 35 cents.

This quarter was otherworldly.Alex Karp, CEO of Palantir, in the company's August 3 earnings release

Tuesday the stock closed up 29.5%, roughly a point short of its best single day on record. Short sellers gave back about $3 billion in one session. Options had priced 11.4%. The stock delivered nearly three times that.

Tuesday · August 4Two Of The Wildest Boards On The Market Report The Same Night

AMD and SpaceX both reported after Tuesday's close, with their conference calls running nearly back to back.

AMD's options priced about an 8.5% move, an implied range near $440 to $523. The company beat on both lines, with adjusted earnings of $1.66 against $1.62 expected and revenue of $11.54 billion against $11.28 billion. Data center revenue grew 107% to a record $6.72 billion. CEO Lisa Su told analysts the company expects data center sales to double in 2027.

The stock gave back nearly 9% in after-hours trading and closed the next session down about 7%. One wrinkle strengthened the lesson rather than muddying it: AMD had rallied roughly 7% during Tuesday's regular session, so the implied move was measured off a price the stock had already left behind by the time the numbers hit.

Benzinga had flagged the trap two days earlier. By its count going into the report, AMD had closed lower the day after earnings in seven of 12 reports since August 2023, and it missed consensus only twice in that stretch. The problem was never the beat. The problem is what gets priced in before the beat arrives, and the premium collapse that follows the release. Our guide to IV crush after earnings covers why a front-week option can lose most of its value within minutes even when the stock moves your direction.

SpaceX had the harder setup. It was reporting as a public company for the first time, seven weeks after its June 12 debut, with no earnings history for anyone to price against. Front-week options were charging up to 223% implied volatility for the privilege. Revenue came in at $7.81 billion, up 92% and well ahead of the $6.93 billion expected.

Capital spending is what moved the stock. Second-quarter capex hit $18.37 billion against a $13.22 billion estimate, with $15.83 billion of it going to AI infrastructure. Shares fell about 8.6% after hours.

What Options Priced vs What The Stock Delivered

Week of August 3 to August 7, 2026 · SPCX figures as of Friday afternoon · click any bar for detail

NameImpliedNet actualPath traveledResult
PLTR11.4%29.5%30.9%Underpriced
AMD8.5%7.0%8.9%Near fair
SPCX17.7%3.1%16.1%Path dependent

Click a bar for detail. All moves are measured from each stock's last close before its report. Net move is where it settled afterward. Path traveled is the furthest it got from that same close in either direction, including after hours.

Sources: implied moves from TipRanks and Seeking Alpha option pricing snapshots taken before each report. Realized moves from CNBC and Quartz market coverage. Figures are point in time.

Thursday · August 6The Day SpaceX Was Supposed To Break

Thursday brought the event everyone had circled. Roughly 911.5 million SpaceX shares became eligible for sale as the first post-IPO lock-up expired, more than doubling the public float from 4.9% of shares outstanding to 11.8%. At Thursday's prices, that is roughly $100 billion of stock walking free in a single morning.

The stock dropped to $105.11 in early trading, more than 50% below its June peak and about 20% under the $135 IPO price. One early investor, Atlanta Falcons safety Jessie Bates III, told CNBC he planned to sell his entire stake.

Then it closed up 6.1%.

Friday it added another 11% in afternoon trading after Argus upgraded the shares to Buy with a $160 target. That put it on track for its best week since listing and the end of a four-week losing streak. Morgan Stanley kept a $300 base case. Bernstein raised its target to $248. Citi held at $200.

The trading lesson sits in the gap between the path and the close. An implied move is measured against where the stock eventually finishes, not the distance it travels along the way, and SpaceX showed why the distinction matters: the stock covered nearly the full implied range during the week yet ended only a few percent from where it started. Whether any given position made or lost money depends on the premium actually paid and when it was closed, which is exactly why the gap between what a stock travels and where it settles decides more earnings trades than direction does. That gap is the practical difference between implied and realized volatility.

More supply is scheduled. CNBC reports another 319 million shares could unlock in late August, with additional tranches through the fall before the full lock-up expires in December.

Friday · August 7A Bad Jobs Number Turns Into A Green Week

Friday morning reset everything. July nonfarm payrolls showed a loss of 23,000 jobs against a Dow Jones consensus of positive 83,000, with May and June revised down by a combined 103,000. The unemployment rate edged down to 4.1% from 4.2%, but for the wrong reason: labor force participation fell to 61.4%, its lowest in more than five years, meaning the rate dropped because people stopped looking, not because hiring picked up.

Traders read the miss as reduced odds of a September rate hike, not as hikes coming off the table. Rate futures cut the September tightening probability to about 44% from 57% before the release. Treasury yields fell across the board. The dollar index slipped. Gold, silver and platinum all pushed higher. Homebuilders, mortgage names, utilities, REITs and telco led the early tape.

The S&P 500 rose 0.4% in Friday afternoon trading, tracking toward a weekly gain of more than 3% after closing above 7,700 for the first time earlier in the run. The Nasdaq was up roughly 5% on the week, on pace for its best since April, carried by a rebound in chips.

Everything Else That Moved

The headline names took the attention. Plenty happened around them.

  • Boeing had its best week since early April, up around 7% through Friday morning. The FAA certified the 737 Max 7 after years of delay and BNP Paribas double upgraded the stock to outperform, though the same week the FAA ordered fuselage crack inspections on nearly 500 other Max jets.
  • Oil fell hard, and early. Brent dropped more than 7% on the week, with most of the damage on Monday's optimism around Iran talks. By Friday the Hormuz negotiation had stalled over a fee dispute, so the slide came from the hope, not the resolution.
  • Airbnb beat and raised guidance, with options going in priced for a high single-digit move. Datadog carried a 15% straddle. Lyft priced 14%. Cloudflare's board leaned heavily defensive at a 2.7 to 1 put ratio.
  • Friday produced real wreckage. Sezzle fell 31% despite beating on both lines. QuidelOrtho dropped 24% on cut guidance. Replimune gave back about 7% the day after winning accelerated FDA approval for its melanoma drug, with Wedbush tying the weakness to a lower response rate on the approved label than the company had previously highlighted.
  • Space stocks rallied together on the SpaceX upgrade, with Rocket Lab up 8% and Intuitive Machines up 9%.

None of this happened in a thin market. Cboe reported second-quarter average daily volume of 72.8 million contracts, up more than 19% from 2025. Cboe's same report puts what it calls "overall" zero-days-to-expiration volume up 46.2% year to date at more than 20 million contracts per day. The volatility spike arrived inside the busiest options market on record.

Three Things To Carry Into Monday

A beat is only worth what was not already priced. AMD proved it twice this week, once in the numbers and once in the tape. The setup going in matters more than the print.

An implied move forecasts size, never direction. Palantir's options were off by nearly three times, and they were still doing their job correctly. The number tells you how far, not which way.

Held to expiration, a front-week option pays off on where the stock finishes, not how far it travels. SpaceX covered nearly the entire implied distance during the week and still closed only a few percent from its starting point. Path is not the same as outcome.

One practical note for anyone sizing around next week's catalysts. Watch how volume distributes across strikes instead of reading the headline put-call ratio, since open interest piled into one far-out strike can distort the whole picture. Our option chain explained guide covers how to read volume and open interest together, and the probability of profit calculator gives a cleaner starting point than the premium alone.

Market data and option pricing figures are point in time and change throughout the session. Implied moves are derived from option prices before each report and are not forecasts of direction. This content is for informational and educational purposes only and is not a recommendation to buy or sell any security or to use any particular strategy. Options involve substantial risk and are not suitable for all investors. Please read Characteristics and Risks of Standardized Options before trading options.

No items found.
mockup
Earnings

SpaceX Earnings: What Experts and Options Expect

SpaceX (NASDAQ: SPCX) reports after Tuesday's close, its first quarterly disclosure since the June 12 debut. Shares traded near $120.63 Tuesday morning, up 5.3% on 44.4 million shares, with the August 7 weekly expiration carrying 234.37% implied volatility and pricing a move of ±$21.30 through Friday. That is an implied range of roughly $99 to $142, or 17.7%, over three trading sessions.

There Is No Volatility Percentile Yet

Most earnings previews anchor implied volatility against its own 52-week range. SPCX has traded publicly for seven weeks, so the 52-week implied volatility high, low and percentile all return no value, and the same is true for historical volatility. The usual IV rank and IV percentile comparison is unavailable, which removes the standard test for whether 234% is expensive relative to this specific stock.

The comparison that remains is cross-sectional. Reuters reports options traders priced a 6.6% move into Microsoft ahead of its report last week, and that SPCX options imply a swing of roughly $225 billion in the company's value. Aggregate implied volatility across all SPCX expirations sits at 117.01% against a VWAP of $118.55.

Wall Street Is Split on What the Company Is Worth

Consensus leaves limited room for surprise on the headline figures. Reuters reports analysts expect revenue of nearly $7 billion and a quarterly loss before interest and taxes of $1.55 billion. The variables carrying more weight are Starlink subscriber growth, launch cadence, capital spending on AI infrastructure, and any commentary on the path toward self-funding.

The valuation debate behind those numbers is unusually wide. Oppenheimer analyst Timothy Horan opened Wall Street's first coverage of the company with an outperform rating and a $190 target, expecting Starlink to carry near-term cash generation and the AI business to become the largest contributor over time.

We see it as the only vertically integrated AI company with the required capital, data, LLMs, hardware, manufacturing and engineering talent.Timothy Horan, Oppenheimer, June 11 initiation note

Morningstar reached a different number, valuing SpaceX at $780 billion in a pre-IPO assessment published in early June, citing uncertainty around the AI business. That figure came in at less than half the valuation the company was targeting at the time, and sits well under today's $1.5 trillion market capitalization. Shares reached an intraday high of $225.64 within days of the debut and closed Monday at $114.53, down about 43% from a closing peak of $201.80. The stock is flagged hard to borrow, and Reuters reports short sellers held an estimated $18.4 billion of mark-to-market gains as of the July 31 close.

The overall volatility level is massive.Ophir Gottlieb, CEO of Capital Market Laboratories, to Reuters

SPCX Implied Volatility and Expected Move by Expiration

Expected move in dollars (bars) and implied volatility (line) · Tuesday morning · August 4, 2026

ExpirationDaysImplied volExpected move
7 AUG 263234.37%±$21.30
14 AUG 2610159.35%±$26.17
21 AUG 2617137.00%±$29.42
28 AUG 2624123.43%±$31.59
4 SEP 2631114.33%±$33.35
11 SEP 2638108.71%±$35.23
18 SEP 2645106.45%±$37.74
16 OCT 267399.55%±$45.82
20 NOV 2610892.44%±$52.70
18 DEC 2613689.79%±$58.37
15 JAN 2716486.15%±$62.19

Source: intraday options data as of Tuesday morning, August 4, 2026. Implied volatility falls from 234.37% at the August 7 expiration to 137.00% by August 21 and 99.55% by October 16, continuing lower to 70.86% at the December 2028 expiration.

The Event Premium Sits Almost Entirely in the Front Week

The expected move is the swing, up or down, that option prices imply for a given expiration, and it runs close to what an at-the-money straddle costs. August 7 prices ±$21.30 at 234.37% implied volatility. One week later that falls to 159.35%, then 137.00% by August 21 and 123.43% by August 28. The curve keeps grinding lower and reaches 70.86% at the December 2028 expiration.

Two events sit inside that front week. Earnings arrive Tuesday night, and the first post-IPO lock-up expires August 6, clearing approximately 911.5 million shares held by insiders, employees and early investors for potential sale. Front-week contracts carrying this much event premium typically lose a large share of their value within minutes of the release regardless of which way the stock moves, a repricing covered in our guide to IV crush after earnings. For how a forecast like 234% compares against what a stock actually delivers, see implied versus realized volatility.

One Strike Distorts the Whole Call Board

August 7 open interest reads as overwhelmingly bullish at first pass. Call open interest totals 827,424 contracts against 268,778 puts, a ratio above three to one. That figure is misleading. The large majority of those calls sit at a single $330 strike, roughly 2.7 times the current share price, while the busiest strike anywhere near the money is the 130 call at 13,220 contracts. Set the $330 block aside and the two sides of the board are far closer to even.

Put open interest is distributed the way pre-earnings protection usually is, with the heaviest concentrations at $115 with 17,001 contracts, $110 with 16,090 and $105 with 14,828. Open interest alone does not establish direction, since covered calls, spreads and institutional hedges all contribute to the totals. Our option chain guide covers how open interest and volume should be read together.

Today's Flow Is Balanced in Size and Split by Strike

Tuesday's volume is close to even. Approximately 316,818 calls and 290,124 puts had traded by late morning, a put-call volume ratio of 0.916. Relative to their own norms the two sides are not equal, though: put volume is running at 2.22 times its typical pace against 1.46 for calls.

Where that volume sits tells the clearer story. Delta measures how much an option moves when the stock moves, and by extension how far from the money it sits. On the put side, 57% of volume is trading at 0 to 20 delta, cheap strikes that function as tail-risk insurance, and only 11% sits at 41 to 60 delta. Calls are distributed further up the curve, with 43% at 0 to 20 delta and 27% at 41 to 60.

Trade location adds one more note. Put volume printed at the bid or below 29% of the time against 23% at the ask or above, a tilt consistent with put selling into the elevated premium. Calls were closer to symmetric at 25% and 26%.

The skew runs against the prevailing bearish narrative. With shares near $120.80, the August 7 136 call sits about 15 points above the money at 235.59% implied volatility while the 105 put sits about 16 points below it at 220.78%. The gap widens further out: the 140 call carries 238.18% despite being the more distant strike. Upside calls are the richer side of this board. Interactive Brokers chief strategist Steve Sosnick told Reuters that traders are willing to speculate on a return toward the $135 IPO price. Reuters also reports the opposite read from positioning data.

The weight of the evidence is the options market is sort of leaning short the stock.Brent Kochuba, founder of SpotGamma, to Reuters

SPCX Option Volume by Delta Bucket

Share of Tuesday's total volume by moneyness · August 4, 2026

DeltaCall volumeSharePut volumeShare
0 to 20136,63643%165,96757%
21 to 4074,46123%82,68628%
41 to 6086,93327%34,63311%
61 to 8016,6795%6,7072%
81 to 1002,1090%1310%
Total316,818290,124

Source: intraday options data as of Tuesday morning, August 4, 2026. Put-call volume ratio 0.916. Put sizzle index 2.222 against 1.46 for calls.

Four Structures That Fit the Data

Four structures from our option strategies library, chosen for this board rather than offered as recommendations. Two constraints drove the picks. A binary event with a lock-up two days behind it argues for defined risk, which rules out naked shorts in the front week. And at 234% implied volatility the premium is the deciding input, so three of the four collect it. A long straddle would cost roughly what the expected move is worth, needing SPCX above $142 or below $99 just to break even.

Strikes reference the August 7 expiration and its ±$21.30 expected move. Prices are Tuesday morning midpoints and will move into the report. Every structure includes a short option, and a short option that finishes in the money can be assigned. Our guide to the option greeks covers how delta approximates the odds an option finishes in the money.

  • Bull put spread · neutral to bullish. Chosen on flow: 57% of put volume is trading at 0 to 20 delta and printing at the bid, so the demand is for cheap tails and the 29 delta put is the richer sale. Sell the 110 put near $5.15, buy the 105 put near $3.38. Collects about $1.78 on a $5 wide spread, so $178 in against $322 at risk, breakeven near $108.22, and the board puts the 110 put about 63% to expire out of the money.
  • Bear call spread · neutral to bearish. Chosen on skew: the 140 call carries 238.18% implied volatility against 220.78% on the 105 put, making calls the richer side to sell. Sell the 135 call near $5.45, buy the 140 call near $4.35. Collects about $1.10 on $5 wide, $110 in against $390 at risk, with the 135 call about 73% to expire out of the money. The thin credit is the tell that call premium stays elevated far above the money.
  • Short iron condor · neutral. Chosen on the term structure: 234% front-week implied volatility against 159% one week out is the premium this trade is selling. It is the two spreads above held together. Sell the 110 put and 135 call, buy the 105 put and 140 call, collecting about $2.88 on $5 wings, $288 in against $212 at risk. The catch is probability, since the board puts SPCX inside the 110 to 135 window only about 37% of the time. Widening the shorts raises those odds and lowers the credit.
  • Collar · neutral to bullish, for holders. Chosen on the same skew, which here lets the call more than pay for the put. Against 100 shares, buy the 105 put near $3.38 and sell the 140 call near $4.35 for a net credit of about $0.97. Floor at 105, cap at 140, net delta drops from 100 to roughly 49.

One structure worth noting sits outside this list because it needs a second expiration to price. The calendar spread sells the August 7 contract at 234.37% implied volatility and buys the same strike in August 14 at 159.35%, which is the most direct expression of the 75 point gap between the two. It also carries the risk that a large move leaves both legs far from the strike.

What Sets the Reaction

The release is one input among several. Guidance on Starlink subscriber growth, launch demand, capital spending on AI infrastructure, and any management commentary on the August 6 lock-up will each move the front-week board. Some holders have already found hedging impractical at these levels. Ascentis Asset Management chief investment officer Clint Sorenson told Reuters his firm dropped a planned synthetic hedge because the cost had risen beyond what clients would accept.

The remaining question is whether the realized move exceeds the ±$21.30 embedded in August 7 premiums. If it falls short, front-week options lose value quickly regardless of direction, and the traders selling into 234% implied volatility keep the difference. If it exceeds that range, the buyers will have paid a fair price for one of the least predictable events on the calendar.

Source: intraday options data as of Tuesday morning, August 4, 2026. Market data and analyst commentary from Reuters, Oppenheimer and Morningstar as linked above. Figures are point in time and change throughout the session. This content is for informational and educational purposes only and is not a recommendation to buy or sell any security or to use any particular strategy. Options involve substantial risk and are not suitable for all investors. Please read Characteristics and Risks of Standardized Options before trading options.

mockup
No items found.

Apple Reports Thursday: What the Options Market Is Pricing

Apple (NASDAQ: AAPL) reports earnings Thursday, July 30, after the close. Open interest, the count of contracts currently held open across all expirations, stands near 2.7 million calls against 2.1 million puts, and the July 31 expiration prices a move of about ±$12.73, or 3.7%, through the report. Wednesday's volume tilts the same way, about four calls for every three puts, with put activity picking up through the afternoon.

Volatility Is Elevated, Not Stretched

Implied volatility is the market's forecast of future movement, backed out from what traders are paying for options. Apple's sits near 31.4%, in the 64th percentile of its 52-week range of roughly 19.5% to 38.1%. Elevated, short of extreme. Realized volatility, the movement the stock has actually delivered, sits in its 60th percentile, so options are pricing only a modest step up from what Apple has already been doing. How that premium is spread across expirations tells you more.

AAPL Implied Volatility and Expected Move by Expiration

Expected move in dollars (bars) and implied volatility (line) · Wednesday afternoon · July 29, 2026

ExpirationDaysImplied volExpected move
31 JUL 26259.58%±$12.73
3 AUG 26542.68%±$13.95
7 AUG 26938.19%±$16.59
14 AUG 261634.20%±$19.70
21 AUG 262332.10%±$22.13
28 AUG 263030.87%±$24.29
18 SEP 265130.32%±$31.10
16 OCT 267930.19%±$38.60
15 JAN 2717031.24%±$59.13

Source: intraday options data as of Wednesday afternoon, July 29, 2026. Implied volatility falls from 59.58% at the July 31 expiration to 30.87% a month out, then flattens.

A Flat Curve Behind the Event

The expected move is the swing, up or down, that option prices imply for a given expiration, roughly what an at the money straddle costs. Wednesday's expiration goes off the board before Thursday night's report and there is no Thursday weekly, so Friday's July 31 expiration is the first one that catches the news. It prices ±$12.73, and the premium behind it drains fast: 59.58% implied volatility for Friday, 42.68% by Monday, 30.87% a month out. From there the curve barely moves through December 2028. A month out and beyond, the market treats Apple as the same stock before and after the print.

Where the Positioning Sits

Open interest tells the longer story. Call open interest clusters at and just above the current share price near $340. Put open interest spreads across strikes below the market. A call-heavy board is not by itself a bullish vote, since covered calls, spreads, and hedges all add to call open interest. Wednesday's flow matches. Delta measures how much an option moves when the stock moves, and by extension how far from the money it sits. Nearly 60% of put volume is trading at 0 to 20 delta, cheap strikes that trade as pre-earnings insurance. Call volume is far more distributed, with about a third at 21 to 40 delta and a quarter at 41 to 60. Trade location adds a timing note. Put volume printed heavily at the bid in the morning, consistent with put selling, and that tilt has evened out as the session progressed.

The setup into the report: implied volatility in the upper third of its year, a flat curve behind the event, calls in the majority on both the open interest and volume side, and a put market dominated by cheap protection. Whatever Apple reports, the front expirations will reprice within minutes. For a closer look at how that premium builds and drains around earnings, see our guide to implied versus realized volatility.

Four Structures That Fit the Data

These four come from our option strategies library, each tied to the data above. They are illustrations of how traders can express different views with the same data, not recommendations of one structure over another. Strikes reference Friday's July 31 event expiration and its ±$12.73 expected move, a priced range near $329 to $354. The front week is where the earnings premium concentrates and drains, and where options move fastest; the same structures work further out for a calmer ride. Deltas and prices are midpoints from Wednesday afternoon's board and will move into the report. Every structure here includes a short option, and a short option that finishes in the money can be assigned, meaning you are obligated to buy or deliver the shares. The premium you actually pay or collect is the deciding input, and delta is often used as a rough approximation of the odds an option finishes in the money.

  • Bull call spread. The board's call tilt with defined risk. Buy the 345 call at about 37 delta, sell the 355 at about 16. Net position runs roughly 21 delta and the debit is the most you can lose. Near $2.60 at Wednesday's mids on a spread worth up to $10, so risking about $260 for a max payout around $740. About one in six odds at the max payout; any profit depends on the debit paid.
  • Short put. The 330 put, bottom of the priced range, trades near $2.45 at about 26 delta. Selling it cash-secured collects the premium the insurance buyers are paying and obligates you to buy shares at 330 if assigned. Roughly 75% odds it expires out of the money at Wednesday's pricing. The tradeoff is a small win most of the time against a large loss if the stock falls hard. Our guide to selling calls and puts covers the risk side in detail.
  • Short iron condor. The direct bet on the front-week premium. Sell the 330 put and 355 call at the range edges, buy the 320 put and 365 call as wings. Collects near $2.55 against $10 wide wings, about $255 taken in versus $745 at risk. Near delta neutral, defined both sides, profits if Apple lands inside the range while Friday's 59% implied volatility resets. Roughly 60% odds at Wednesday's pricing.
  • Collar. For shareholders through the print. Against 100 shares, buy the 330 put and sell the 355 call; the call covers about half the put for a net debit near $1.25. Floor at 330, cap at 355, and net delta drops from 100 to roughly 60.

Payoff Shapes at the July 31 Expiration

P/L at expiration by stock price · shaded band = ±$12.73 expected move ($329 to $354) · yellow dash = current price · grey dash = zero P/L · shapes illustrative, not to scale

Bull Call Spread

329 342 354

Long 345 call, short 355 call. Loss capped at the debit. About 1 in 6 odds of the max payout.

Short Put

329 342 354

Cash-secured 330 put, about 26 delta. Full premium kept above the strike, roughly 75% of the time. Losses grow below it.

Short Iron Condor

329 342 354

Shorts at 330 and 355, wings at 320 and 365. Roughly 60% odds Apple finishes between the shorts. Risk defined both sides.

Collar

329 342 354

Stock plus a 330 put, financed by a short 355 call. Floor below, cap above, full exposure in between.

Payoff shapes at expiration for the structures described above. Odds are approximations from the expected move and delta as of Wednesday, July 29, 2026.

Source: intraday options data as of Wednesday, July 29, 2026. Figures are point in time and change throughout the session. This content is for informational and educational purposes only and is not a recommendation to buy or sell any security or to use any particular strategy. Options involve substantial risk and are not suitable for all investors. Please read Characteristics and Risks of Standardized Options before trading options.

No items found.
mockup
Options Trading

AMC Options Are Trading at Six Times Their Normal Pace

The apes are back on the tape. AMC Entertainment (NYSE: AMC) is up about 20% as of Monday afternoon, near $2.33 from Friday's $1.94 close, a stock still down roughly 99% from its 2021 meme era highs even after the jump. The move itself is not the story. The options board is. SpotGamma data cited by CNBC's Squawk on the Street earlier in the session showed roughly five calls trading for every put. By our latest read the ratio has come in to about four to one, 232,352 calls against 55,170 puts on 287,522 contracts, as put activity picked up through the afternoon.

Six Times Normal

Total options activity is running about six times AMC's own average pace. For scale, put it next to AMD, a $510 semiconductor giant having a busy day of its own, with implied volatility in the 96th percentile of its year and options activity near double its average. AMD has traded about 366,000 contracts. AMC, a $2.33 stock, has done more than three quarters of that count, and where AMD's flow runs a routine two calls per put, AMC's runs four. That mismatch between options activity and company size is the meme signature.

Options Contracts Traded: AMC vs AMD vs IMAX

Calls and puts · as of Monday afternoon · July 20, 2026

NameCallsPutsCalls per put
AMC232,35255,1704.2
AMD244,577121,8432.0
IMAX2,46713518.3

Source: intraday options data as of Monday afternoon, July 20, 2026. A $2.33 stock traded more than three quarters as many contracts as AMD; AMC ran four calls per put to AMD's two.

Bullish From Both Sides of the Board

Options flow is simply the stream of trades hitting the market, and each completed trade, called a print, carries a clue about who initiated it. A print at the ask means someone accepted the seller's offer price, which generally marks the buyer as the aggressor. A print at the bid marks the seller. By that read, Monday's flow leans bullish from both directions: 51% of call volume traded at the ask against 33% at the bid, consistent with call buyers paying up, while nearly half of all put volume traded at the bid, consistent with put selling. Put activity has been catching up through the afternoon, but the selling tilt on that side has held.

Delta is the other clue. It measures how much an option moves when the stock moves, so a 70 delta call behaves mostly like the stock itself while a 10 delta call is closer to a lottery ticket. Monday's mix breaks from the 2021 caricature: only 16% of call volume sits in those far out of the money lottery strikes, while nearly a quarter sits at 61 to 80 delta. On a $2.33 name even high delta calls cost pocket change, and a meaningful share of Monday's buyers chose stock-like exposure over lottery tickets.

AMC Volume by Delta Bucket

Contract volume grouped by absolute delta · as of Monday afternoon · July 20, 2026

Delta bucketCallsPutsCall share
0 to 2037,59414,84116%
21 to 4074,80934,28632%
41 to 6054,1285,74823%
61 to 8056,93328824%
81 to 1008,88873%

Source: intraday options data as of Monday afternoon, July 20, 2026. Nearly a quarter of AMC call volume traded at 61 to 80 delta.

A Thin Board and an Inverted Skew

The board is thinner than most traders expect: six expirations, nearest August 21, no weeklies. Every position carries at least a month of time decay. Implied volatility, the market's price on future movement, sits near 132% at the money, which ranks in the 69th percentile of AMC's 52 week range, with realized volatility in the 91st. Rough math on that level prices about an 8% daily move, and the platform's expected move for the August 21 expiration is about ±$0.76, roughly a third of the stock price. Since IV varies by expiration and strike, run the number for the series you trade. The skew, the way implied volatility differs from strike to strike, is the detail to remember: on AMC, call IV rises as strikes go higher, well above the at the money level in the front series. The market charges most for exactly what Monday's buyers want, a big move up.

IMAX Woke Up, With an Asterisk

If this were a theater trade, IMAX would confirm it. It mostly does not. The stock is down about 1% near $38.90, and while its board is running about twice its normal pace at roughly eighteen calls per put, the volume is tiny at about 2,600 contracts, 89% of it concentrated at the money, most printing between the market or at the bid. That fits structured prints or covered call writing, not a retail chase. Monday is a meme name story, not a theater story.

Where the Opportunity May Sit

None of this is a recommendation, and everything here carries substantial risk, starting with AMC's history of severe drawdowns.

  • High delta calls are the flow's own trade: most of the stock's movement for a small outlay, with risk limited to the premium, the price paid for the option. The cost is that 100%+ vol and a month to the nearest expiration bleed time value if the stock stalls.
  • Call verticals, buying one call and selling a higher strike call against it, put the skew to work: the option sold is among the richest priced on the board, which lowers the cost of the trade at the price of a capped payoff.
  • Cash-secured puts are the other side of the crowd, with nearly half of Monday's put volume trading at the bid. The premium is rich for a reason: selling puts means a seller can be assigned, required to buy the shares at the strike, into a collapsing position, and a strike can go to zero.
  • On the vol decision, 69th percentile IV against 91st percentile realized gives neither buyers nor sellers an obvious edge. The straddle price at any expiration is the cleanest read on what a move costs here, and the choice comes down to structure and sizing.

Sources: CNBC, Squawk on the Street, "The Return of the Apes," July 20, 2026, citing SpotGamma data on AMC options flow. Options statistics, delta distributions, execution location, implied volatility by strike, and underlying quotes for AMC, IMAX, and AMD per the TradingBlock platform, Monday afternoon, July 20, 2026; all figures in this article reflect that snapshot unless noted and are point in time, not full session totals. Related coverage: SK Hynix Options Start Trading Tuesday. Here Is the Playbook.

Options involve risk and are not suitable for all investors. Prior to buying or selling an option, a person must receive a copy of Characteristics and Risks of Standardized Options, available from your broker or at theocc.com. This content is for educational purposes only and is not a recommendation.

No items found.
mockup
0DTE
Backwardation
Options Trading
Options Analytics

SKHY Options: The Biggest Trades Leaned Bearish

SK Hynix options began trading Tuesday, and the opening session looked very different from what many expected. Rather than a wave of speculative call buying, Cboe LiveVol data cited by CNBC showed the most active directional flow was call selling, with the seven largest option prints of the session all classified as bearish. The biggest appeared to be the sale of more than 2,200 July 17 $180 calls at roughly $9 each, representing about $2 million in premium collected.

The stock has been a ride. Priced at $149, the ADRs opened at $170, surged more than 20% Tuesday as options and leveraged ETFs went live, then reversed hard. SKHY traded near $163 Thursday afternoon after Seoul closed 11.5% lower in an Asian chip rout, roughly 15% off Tuesday's close in two sessions. The bulls have not gone quiet: Barclays initiated at Overweight this week.

Five Weeklies, Two Days In

Volume was solid rather than spectacular. CNBC counted about 150,000 contracts by midday Tuesday, more than the VanEck Semiconductor ETF but under a third of Micron's, and the full session finished north of 218,000 by other counts. One explanation for the muted call buying: a dozen leveraged single-stock ETFs launched the same day and absorbed much of the speculative flow. Desks expected weeklies to be the next catalyst. They arrived fast, five of them, July 24 through August 28, hitting the board Thursday morning.

The Vol Cliff

We pulled ATM implied volatility for every listed SKHY expiration from the TradingBlock platform Thursday, hours after the weeklies listed, with the stock near $165. The front contract, then one day from expiration, quoted 179%, a ±$14 expected move into Friday's close. From there the curve falls off a cliff: the new weeklies priced the coming weeks between 93% and 117%, September near 113%, December near 104%, fading toward 90% by the end of 2027.

TradingBlock Now · Interactive

The SKHY Vol Cliff

ATM implied volatility across the SKHY board, snapshotted July 16, hours after five weekly expirations listed. Hollow points are the new weeklies. Tap any point for detail.

Source: TradingBlock platform, midday July 16, 2026, SKHY near $165. Hollow points are weeklies listed July 16; those markets are hours old, so quotes are thin and the kinks around the August monthly reflect that. ATM implied volatility and ±1 standard deviation expected move per expiration. Snapshot only; live values change constantly. Not a forecast or a recommendation. Options involve risk and are not suitable for all investors.

A curve sloping down this steeply has a name: backwardation. Near-dated contracts price higher implied volatility than longer-dated ones, which means lower future implied volatility is already built into the further expirations. If implied volatility falls that way in practice, long premium positions face a second headwind on top of direction. IV crush is what traders call that, and it means a call can be right on direction and still lose if volatility drops enough. SpaceX offers a recent parallel. Implied volatility on its options fell from near 160% at launch toward 110%, and as vega worked against long positions, many buyers on both sides of the market saw premiums decline even when the stock moved their way. Outcomes still varied by strike, expiration, and timing.

Earnings Are Now on the Board

SK hynix confirmed its second-quarter results call for July 29 in Seoul, the evening of July 28 in US markets. That makes the July 31 weekly the first expiration to capture the print, making the new weeklies more relevant. In Thursday's snapshot the August 14 weekly quoted 93% implied volatility against 124% at the August 21 monthly. Kinks like that can reflect the thin liquidity typical of newly listed expirations. Treat weekly quotes, and weekly fills, with care until volume builds.

What Open Interest Says

One caveat first, because it trips up a lot of traders. Open interest is not live. The OCC publishes it once a day after processing the prior session, so the numbers on your screen this afternoon reflect positions through yesterday's close. Volume in the next column over is live. Two different clocks, side by side.

As of Wednesday's close, open interest was concentrated in downside puts and higher-strike calls. The July 145 puts held more than 37,000 contracts, by far the biggest line on the board, and the July 175 through 200 calls held several thousand apiece. That tracks with the debut session, where Bloomberg reported the $185 call was the single most active contract and the $145 puts were next. Open interest shows where contracts are open, not who is long or short them, so it says nothing about whether those lines are outright positions, spreads, covered stock, or dealer inventory. What it does mark is where the market has built. Whether those concentrations survived Thursday's slide will not be confirmed until the next OCC update, which is why volume against open interest is worth watching in a name this young. Read our option chain explained guide if those columns are new to you.

Hard to Borrow, and It Matters

As of Thursday's board, SKHY was flagged hard to borrow. Shares to short are scarce and expensive, which props up put prices and makes the arbitrage that would normally pin the ADR to its Seoul parent more difficult and expensive. Rich can stay rich, and the ADRs have traded at a wide premium to the Seoul shares since the debut.

The Skew: What Protection Costs

Implied volatility is not one number per expiration. It changes strike by strike, and that shape, the skew, shows where premium is richest. In the same Thursday snapshot the expiring July puts were extreme: near 156% at the money, 182% at the 150s, and 217% at the 135s, about 18% out of the money. Implied volatility increased as strikes moved lower. One month out the effect nearly vanished, with August puts clustered between 119% and 123%.

TradingBlock Now · Interactive

The Price of Protection, Strike by Strike

Put implied volatility by strike for the expiring July contracts against the August monthly. The July curve climbs hard into the downside strikes. August barely slopes. Tap any point.

JUL 17 · 1 DTEAUG 21 · 36 DTE

Source: TradingBlock platform, midday July 16, 2026, SKHY near $165. Out-of-the-money put implied volatility by strike. Snapshot only; live values change constantly. Educational only, not a recommendation. Options involve risk and are not suitable for all investors.

Read together, the curves show downside protection priced at a steep premium in the front expiration and close to flat a month out. That shape changes the math on nearly every structure. Outright puts are the priciest protection, because steep skew is a surcharge on exactly the strikes buyers want. Put spreads lean against it, since the put sold is relatively richer than the put bought. Collars finance a put by selling a call, though quoted call premiums here carry a hard-to-borrow distortion. And put sellers collect the higher premium associated with that skew, taking on the corresponding downside risk, which is why cash-secured put writers see such large credits well below the market. The surcharge reflects elevated demand for near-term downside insurance. None of this is a recommendation. It is how the curve prices risk, and knowing where skew sits is the difference between paying it and collecting it.

Bullish, Bearish, or Neutral: How Traders Are Framing It

None of what follows is a recommendation. It is a description of the structures traders use when implied volatility runs this hot: long, short, or the trade that dominated day one, selling the premium itself. Pick a stance and tap through. Premiums are illustrative, drawn from Thursday's August board.

TradingBlock Now · Interactive

Bullish, Bearish, or Neutral: The High-Vol Playbook

Nine ways traders frame a stock near $165. All structures use the August 21 monthly, 36 days out, near 124% implied volatility on Thursday's board. Pick a stance, tap a structure. Education, not advice.

Payoffs at the August 21, 2026 expiration, per share, before commissions. Premiums rounded from the August board, midday July 16, 2026. Short options carry substantial risk, including assignment and losses that can far exceed the premium collected. Educational only, not a recommendation.

Two threads run through all nine. Sellers are paid extraordinary rent, but the expected move is priced that wide for a reason, and the risk taken to collect it varies enormously by structure: a covered call caps upside on stock already owned, while a naked strangle carries undefined risk on both sides. Buyers face the mirror problem: every long option pays for a huge move, then fights the implied volatility normalization priced into the curve. The straddle price at any expiration is the cleanest read on what a move costs, and across this board it costs a lot everywhere.

Bottom Line

The first week delivered a seller's market at extreme volatility, an inverted volatility term structure pricing lower future implied volatility, and a borrow-constrained stock still carrying a premium to Seoul. Weeklies are live, earnings land July 29, and the vol curve will tell the story from here. We will keep tracking it. For launch-week context, start with our SKHY options playbook. Newer to this? Our free options trading course covers expected moves, spreads, and volatility from the ground up, and option strategies breaks down every structure above.

Sources: CNBC, day-one options flow and volume via Cboe LiveVol · Seeking Alpha, debut activity in the July 17 expiry · Seeking Alpha, implied volatility and leveraged ETF dynamics · Bloomberg, debut session most-active contracts · CNBC, Seoul shares fall 11.5% in Asia chip rout · Reuters, single-stock ETF filings. SK hynix, Q2 2026 earnings call scheduling (Form 6-K). Volatility term structure, expected moves, skew, and borrow status per the TradingBlock platform, midday Thursday, July 16, 2026; all option figures in this article reflect that snapshot unless noted. Open interest per the same platform, reflecting the OCC's most recent daily update as of the prior session's close.

Options involve risk and are not suitable for all investors. Prior to buying or selling an option, a person must receive a copy of Characteristics and Risks of Standardized Options, available from your broker or at theocc.com. This content is for educational purposes only and is not a recommendation.

mockup
Derivatives
Options Trading

SK Hynix Options Start Trading Tuesday. Here Is the Playbook.

SK Hynix priced 177.9 million American depositary receipts at $149 on Thursday night. The stock opened at $170 on the Nasdaq Friday morning, a 14% pop. The $26.5 billion raise is the largest US share sale ever completed by a foreign company, topping the record Alibaba set in 2014. Demand ran more than seven times the shares available. The debut valued the company around $1.27 trillion, which slots it in as the 11th largest name on US markets, just above Eli Lilly.

That alone would be a story. Here is why it matters more to options traders: Reuters reported Friday, citing sources familiar with the plans, that exchanges including Cboe and Nasdaq expect to list options on the new ADRs two business days after the debut. Count it out and contracts could be trading Tuesday, July 14.

New listings normally make traders wait. This one will not.

The mechanics first

Get the ticker right before Tuesday. The ADRs trade in when-issued mode under SKHYV through Friday. Regular-way trading begins Monday, July 13 under SKHY, per Nasdaq's listing notice. Each ADR represents one tenth of a Seoul-listed common share. The offering itself closes July 14, and the newly issued shares underlying the ADRs list on the Korea Exchange July 29.

Why these options are different

SK Hynix is not just another semiconductor name getting a US listing. It is the world's leading producer of high-bandwidth memory, the stacked DRAM that feeds Nvidia's AI accelerators. The company's own SEC filing puts its HBM share at 56.4%. Nvidia is the biggest HBM buyer, and the two companies announced a multiyear partnership in June when Jensen Huang visited Seoul.

Until Friday, a US options trader who wanted exposure to AI memory demand had a short menu: Nvidia, AMD, Micron, Broadcom, or a sector ETF like SOXX. SKHY adds the dominant supplier of the memory layer itself. If volume builds, SKHY slots directly into the core AI options complex.

What to expect when trading opens

New high-profile option listings follow a pattern. Implied volatility prints high, markets start wide, speculative call flow shows up early, and dealer hedging of that flow can push the stock around. Expect all of it here. The debut also lands after a rough stretch for chip stocks, so the first prints in SKHY vol will double as a live reading on how much fear or greed is left in the AI trade.

The freshest comp is SpaceX. Its options launched last month and drew record volumes almost immediately, proof that a hot new name can go from zero to one of the most active options boards on the tape in days.

One more wrinkle. With no trading history, IV rank and IV percentile will be useless on this name for months. There is no one-year range to compare against, so every read on whether SKHY vol is rich or cheap has to come from comps like Micron instead.

Since nobody can quote SKHY implied volatility yet, we built a tool for the wait. Set an IV level and see what the market would be pricing in. That expected move is what an at the money straddle is priced to capture. When real quotes print Tuesday, check your guess.

TradingBlock Now · Interactive

SKHY Expected Move Explorer

SKHY options are not trading yet. Pick an implied volatility and see what the market would price in. Score your guess when live quotes print.

Expected move = price × IV × √(days ÷ 365). Thick bar is one standard deviation (about a 68% range), thin bar is two (about 95%). Illustrative only, not a forecast or a recommendation. Options involve risk and are not suitable for all investors.

The premium is its own trade

Here is the part most coverage is skipping. The ADRs priced at roughly a 3.1% premium to the Seoul shares. At Friday's open near $170, against a Seoul close around $1,445 per common share, the premium was closer to 18%. HSBC thinks it can run to about 20%.

Textbook arbitrage says a gap like that should close fast. This one may not, because the conversion mechanism only works freely in one direction. ADR holders can cancel their ADRs and take delivery of Korean shares. Going the other way, buying in Seoul and creating new ADRs, can require approval from Korean regulators. Discounts get arbed away. Premiums can stick.

That asymmetry matters for options pricing too. A persistent premium, and the possibility it compresses, is a source of ADR-specific volatility that has nothing to do with DRAM prices, the memory chips that drive SK Hynix earnings.

What comes next

The product wave is already forming. At least ten fund managers, including Direxion and ProShares, have filed to launch single-stock ETFs tied to SK Hynix. The market also widely expects the stock to join the Nasdaq 100 at the December rebalance, which would bring steady passive buying from index funds.

Then there is the valuation gap. FactSet data at the debut puts SK Hynix near 5.4 times forward earnings against roughly 6.7 for Micron, even though the market expects SK Hynix to grow revenue and earnings faster this year. Part of the bull case for the ADRs is that a US listing, index inclusion, and US-style coverage close that gap over time.

Bottom line

Tuesday is the date. Brand-new options on the dominant AI memory supplier, opening into elevated volatility, with an ADR premium dynamic underneath it that most participants have never traded. Know the mechanics before the first print. And if you want a refresher before Tuesday, our free options trading course covers everything from expected moves to spreads.

Sources

Nasdaq Trader, Data Technical News #2026-11 (ticker schedule and settlement) · Reuters, options expected two business days after debut · Reuters, single-stock ETF filings · Bloomberg, debut and offering size · SK hynix, listing announcement · CNBC, company profile and Nvidia partnership · Direxion, SEC prospectus for the Daily SK Hynix Bull 2X ETF. Market share per the company's SEC filing; valuation figures per FactSet data reported at the debut.

Options involve risk and are not suitable for all investors. Prior to buying or selling an option, a person must receive a copy of Characteristics and Risks of Standardized Options, available from your broker or at theocc.com. This content is for educational purposes only and is not a recommendation. TradingBlock is a member of FINRA, NFA, and SIPC.

mockup
0DTE

0DTE Options Just Set Records Across the Board

Cboe Global Markets reported record options trading volume for June 2026 in its monthly volume release published July 6. On June 5, 33.4 million contracts traded across the company's four options exchanges, a single-day total volume record. SPX options set a single-day record of their own that session, with 7.8 million contracts traded.

Behind the headline totals, the fastest-growing segment of the market is the contract with the shortest lifespan: options that expire the same day they trade.

Zero-days-to-expiration options, known as 0DTE, expire at the close of the same session in which they trade. The activity is not new: every option eventually reaches expiration day, and traders have always traded on it. What is new is the name and the frequency. A decade ago, same-day trading mostly meant expiration Friday, and nobody needed an acronym for it. Once expirations became a daily event, the industry adopted one. The June release included record monthly and quarterly average daily volume for SPX 0DTE, and since listed options have traded in the U.S. only since 1973, no earlier period has packed this much volume into contracts measured in hours.

The June Numbers

June's totals came in at 23.0 million contracts per day across Cboe's four exchanges, with the second quarter averaging 21.9 million, records on both counts. Multi-listed options, the standard equity and ETF contracts, ran 16.6 million per day against 11.8 million a year earlier, a 40.5% increase, while index options climbed 36.8% to 6.3 million.

AVERAGE DAILY VOLUME, CONTRACTS
June ADV vs. a year ago
Millions of contracts per day across Cboe's four options exchanges
11.8
+40.5%
16.6
4.6
+36.8%
6.3
Jun 2025multi-listed
Jun 2026multi-listed
Jun 2025index
Jun 2026index
Source: Cboe Global Markets, June 2026 volume report

Within the index complex, the same-day contract did most of the work. SPX 0DTE averaged a record 3.3 million contracts per day in June. For the second quarter it averaged 3.1 million per day against total SPX volume of 5.1 million per day, both records, putting same-day contracts at roughly 60% of SPX volume for the quarter.

Mini-SPX (XSP) options, the one-tenth-size version of the contract, set records of their own at 229 thousand contracts per day for the month and 195 thousand for the quarter. Records fell overnight as well: Cboe's Global Trading Hours session averaged 205 thousand contracts in June and 189 thousand for the quarter, both highs for the session.

How We Got Here

For most of the history of listed options, contracts expired once per month, on the third Friday. Cboe introduced weekly SPX expirations in 2005, added Wednesday expirations in 2016, and in 2022 began listing SPX expirations for every trading day of the week.

The 2022 expansion is where the curve steepens. 0DTE trading accounted for about 5% of SPX options volume in 2016. By 2023 the share had crossed 40%, and by 2025 SPX 0DTE was averaging 2.3 million contracts per day, or 59% of all SPX volume. The pattern held beyond SPX: across the broader U.S. options market, 0DTE reached 24.1% of total listed volume in 2025, up from 21.5% in 2024 and nearly double the 2022 share.

SPX 0DTE, CONTRACTS PER DAY
Average daily volume, by averaging window
Overlapping windows, not a timeline. June 2026 is the final month of Q2 2026.
2.3M
3.1M
3.3M
2025full-year average
Q2 2026quarterly record
June 2026monthly record
Source: Cboe Global Markets; 2025 average per Cboe year-end data

June's 3.3 million contracts per day sits well above the full-year 2025 average of 2.3 million, and the 2025 figure itself capped more than five-fold growth over the prior three years, a pace more consistent with a structural change in how the market trades than with a passing surge.

Who Is Trading 0DTE

Critics have tended to describe the boom as retail speculation. The exchange's own trade data complicates that reading. Cboe can see every SPX transaction, since all SPX options trade on its exchange, and its trade-level research puts retail at roughly 50% to 60% of SPX 0DTE volume.

What that retail flow looks like is the surprising part. More than 95% of 0DTE trades are executed in defined-risk formats, long options or spreads with a known maximum loss, and only about 4% of the volume involves naked short options. Typical structures include iron condors in low-volatility sessions, put spreads ahead of economic data, and call spreads on directional moves. Institutions use the same expirations to trim exposure around Federal Reserve decisions and other scheduled events, which keeps the flow moving in both directions.

That balance matters for market stability. With buyers and sellers roughly offsetting, net market maker gamma hedging has stayed near 0.2% of SPX daily liquidity, by Cboe's analysis, which helps explain why repeated predictions that 0DTE would destabilize the broader market have not come true.

Why Now, and What It Means

Part of the answer is cost. Commissions have fallen to near zero and SPX markets have tightened, which makes a same-day round trip cheap to execute. Part is precision, since daily expirations let a trader isolate a Fed meeting or an inflation report without holding exposure past the event. Analytics that were institutional-only a decade ago now ship standard in retail platforms. And cash-settled index options such as SPX and XSP are European-style with no early assignment, which removes one of the operational complications of same-day trading.

The segment's footprint now reaches well past the people placing the trades. Dealer hedging of same-day flow shapes intraday support and resistance, short-dated activity changes how implied volatility behaves in the final hours of a session, and each record month pulls more of the market toward shorter timeframes and defined-risk structures. June set a high bar. On the current trajectory, it may not stand for long.

Sources: Cboe Global Markets, June 2026 Monthly Volume and RPC Report (July 6, 2026); Cboe Insights, 0DTEs Decoded; Cboe and OCC year-end volume data as reported by Traders Magazine.

Options involve risk and are not suitable for all investors. Before trading options, read The Characteristics and Risks of Standardized Options. For educational purposes only; not a recommendation of any strategy or security.

mockup
Options Trading

SPCX Options Are Pricing Moves Nearly Double NVDA's

SpaceX went public on June 12 under the ticker SPCX, and the first two and a half weeks have been a roller coaster: an open near $150, a close near $161 on day one, an all-time high of $225.64 on June 16, and an all-time low of $147.11 on June 23. As of June 29 the stock is trading around $156. The more interesting number is what the options market is quoting for where it could be a month, a year, and two years out, and those numbers are big.

For most of my career as an options broker I was constantly watching implied volatility and expected moves across hundreds of names. You develop a feel for what normal looks like at each expiration. SPCX stuck out. The premium on this chain runs well above what I am used to seeing on a stock this liquid. For context I pulled NVDA, a stock everyone accepts is volatile, for the same expirations. It isn't close. A month out, SPCX prices nearly twice the move the market wants on NVDA, and stays richer all the way out to two years. This is a brand-new listing, and the chain is telling you the market has very little settled about it.

The expected move, three ways

The cleanest way to read what the market expects is the at-the-money straddle: buy the call and the put at the strike nearest the stock price, add up what you pay, and that is roughly the move the stock has to make by expiration to break even. It is the price of the expected move, in dollars you would actually spend.

For SPCX, currently trading at $156:

The ~1 month expiration (32 days out) prints an at-the-money straddle of about $26.50, the 155 call plus the 155 put. That is roughly 17% of the stock's value in a single month. A buyer needs the stock to move more than $26.50 in either direction to break even. Note this expiration lands in late July, just before the company's first earnings report on August 6, so the biggest known catalyst sits just outside this window.

The ~1 year expiration (353 days out) prints a straddle of about $77, or roughly 49% of spot. The market is not expressing a view on direction here. It is saying the range of plausible outcomes a year out is very wide, wide enough that a near-50% round trip in either direction is on the table.

The ~2 year expiration (718 days out) prints a straddle of about $99, or roughly 63% of spot. That is a large number, but worth being precise about. It does not say the stock is a coin flip between zero and double. It says owning both sides of this name for two years costs you nearly two-thirds of the share price, which is what happens when you stretch a 60%-plus implied volatility across that much time. The takeaway is the width itself: a low-confidence view of where this lands two years out.

spcx future pricing

Why the number is this big

Three factors help explain the premium.

First, implied volatility on SPCX sits in the 70% to 80% range across the curve. NVDA, by comparison, runs in the low-to-mid 40s. SPCX is carrying roughly twice the implied volatility of one of the most volatile megacap names on the board.

Second, the float. This matters most for a new listing, and it is the real engine behind the number. Only about 4% to 5% of SpaceX shares trade publicly right now. The rest is locked up. A tiny float magnifies every move, because a small amount of buying or selling pressure swings the price hard. That is exactly what produced the run to $225 and the slide back to $147 inside two weeks. The options market sees that realized volatility and prices implied volatility to match.

Third, a calendar full of known catalysts, all of them mechanical. SpaceX joins the Nasdaq-100 on July 7, which forces index funds to buy the stock into that thin float regardless of price. First earnings land on August 6 and trigger the first wave of insider unlocks. From there, lockups release in stages through the fall, with a large block freeing up in December. The market is pricing a stock whose supply is about to change dramatically, on a known schedule. That is a recipe for rich premium at every expiration.

There is a second-order point worth its own sentence. As those lockups release and the float grows, day-to-day volatility in the name is widely expected to come down. A bigger float is harder to push around. So the elevated long-dated premium on this chain is priced against a supply picture set to loosen considerably. Whether the curve is pricing that correctly is exactly the debate an options trader should be having.

The NVDA comparison

I used NVDA's chain for the same three expirations as a benchmark, because NVDA is a stock everyone already understands is volatile. Same method for both: the at-the-money straddle as a percentage of the share price.

At ~1 month, NVDA's straddle is about $17 on a ~$196 stock, or about 9%. SPCX is at 17%.

At ~1 year, NVDA's straddle runs about 33%. SPCX is at 49%.

At ~2 years, NVDA's straddle runs about 47%. SPCX is at 63%.

Put it in a single ratio: at one month SPCX prices about 1.9 times NVDA's move, at one year about 1.5 times, and at two years about 1.3 times. The premium is widest now and compresses further out. That fits the story. The near-term chain is loaded with float-squeeze risk and a maiden earnings report, the exact things that should fade as supply unlocks and the company builds a track record. The market is paying up most for the part of the timeline it can see the least into.

spcx vs nvda option premiums

SPCX is not being priced as a permanently wild stock. It's being priced as an unusually uncertain one right now, with that uncertainty expected to ease, just slowly, and never quite down to a name like NVDA even two years out.

What an options trader does with this

None of this is a recommendation, and the structures cut both ways.

If you like buying premium (long straddles, long calls, long puts) you are paying for that rich implied volatility. The expected move is wide, but wide because the options are expensive. The stock has to actually deliver moves larger than what is already priced for a long-volatility position to win.

If you like selling premium (covered calls, cash-secured puts, spreads) that same rich implied volatility is what you collect. The risk is the other side of the same coin: in a name that can move this much, a short option carries real tail risk, and defined-risk structures exist for exactly that reason. With known event dates on the calendar, a short premium position is short those events too.

The honest read is that SPCX's chain is not so much mispriced as uncertain-priced. The width of the expected move is the market admitting it does not know, against a float and a catalyst calendar both still unresolved. Your job as an options trader is to decide whether that uncertainty is overstated or understated, and to structure the position so that being wrong does not end you.

The bottom line

The options market is currently pricing SPCX to move about 17% in a month, 49% in a year, and 63% over two years, running 1.3 to 1.9 times the implied move of NVDA depending on the expiration. That is not a forecast of direction. It measures how little is settled about a two-week-old listing with a tiny float and a calendar full of supply-changing events.

For traders, the expected move is the price of admission either way. Whether you are paying it or collecting it, the first step is reading it correctly.

Figures sourced from live option chains as of June 29, 2026, with the underlying marked at $156.02. Implied moves are quoted as the at-the-money straddle, the combined cost of the nearest-strike call and put, expressed as a percentage of spot. Options involve risk and are not suitable for all investors. This article is for educational purposes and is not a recommendation to buy or sell any security or to employ any specific strategy.

the brokerage behind it

Pro grade options tools.
Open to everyone.

20+

Years serving
options traders

TradingBlock Now is a media brand affiliated with TradingBlock, a brokerage built by options people for options traders. Tight pricing, serious execution, and a U.S. trade desk staffed by seasoned options professionals you can actually call. The same platform is now open to traders at every level: low rates, a web-based terminal you can customize block by block, and a mobile app to trade on the go.