.png)
CRWV, NBIS, AMAT, CSCO: What Options Are Pricing Into a CPI Week
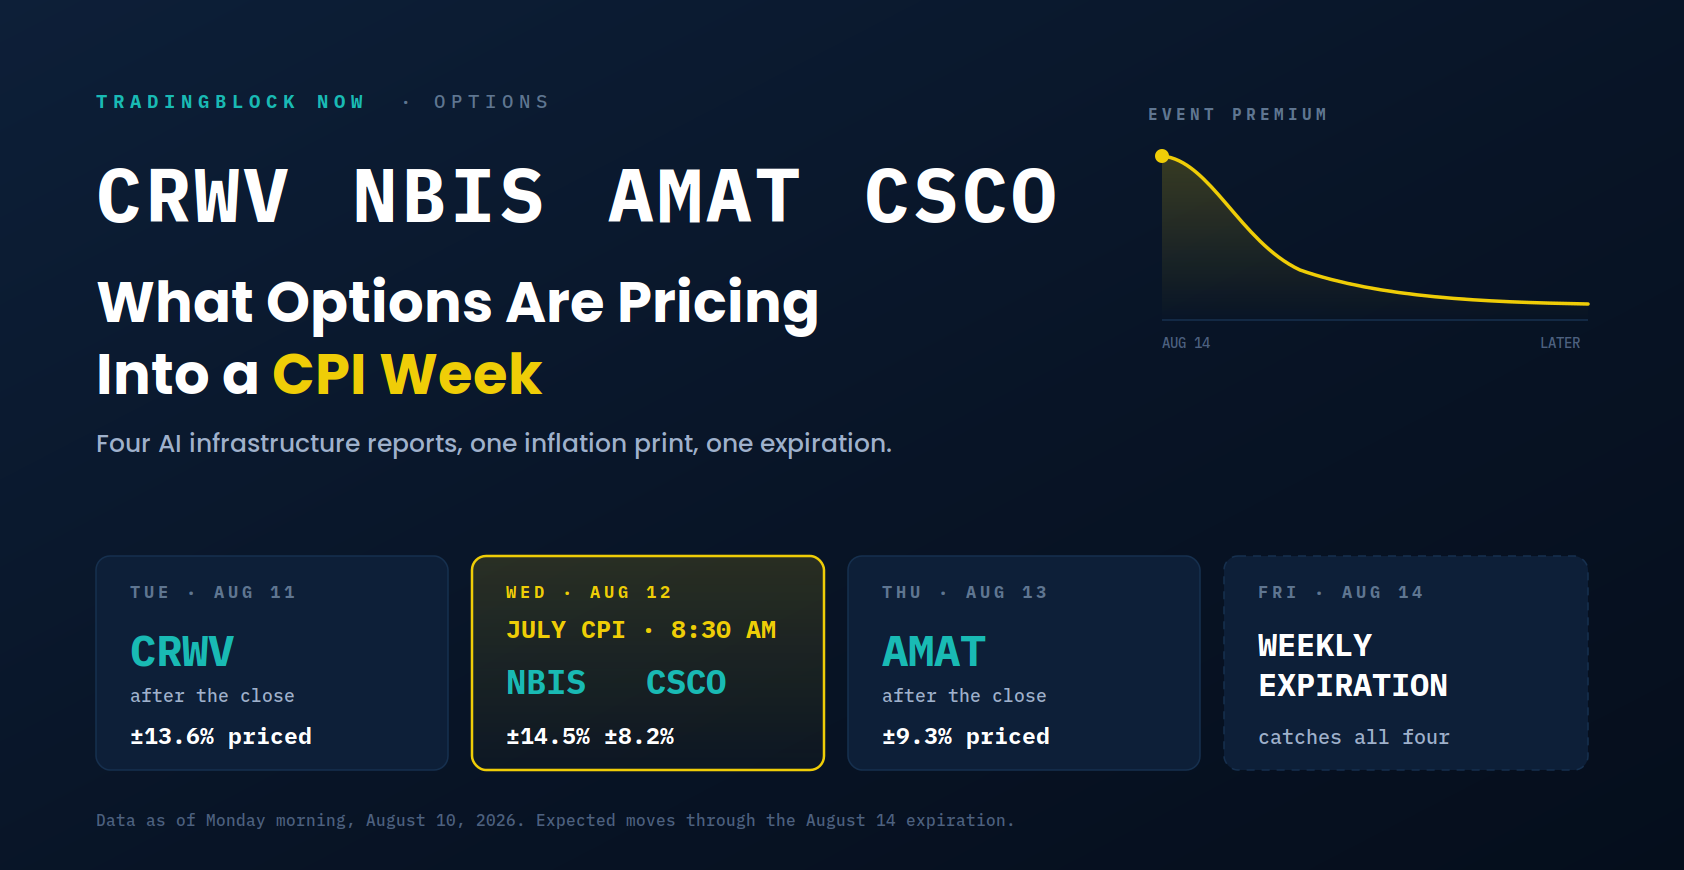
Four AI infrastructure names report around Wednesday's inflation print, all of them expiring into the same Friday weekly. Here is what each board is charging.

At a Glance
- CRWV: Options price a 13.6% earnings move, below its recent average earnings move of 16.76%.
- NBIS: Biggest expected move of the group at 14.5%, with options flow leaning bullish.
- CSCO: Smallest expected move at 8.2%, but IV is historically elevated at the 82nd percentile.
- AMAT: Options price roughly a 9.3% move, with unusually heavy downside put activity.
- Big picture:CPI Wednesday adds macro risk, particularly to NBIS and CSCO, which report that same day.
Four AI infrastructure names report between Tuesday and Thursday, and the July inflation print lands in the middle of them. Every one of those events falls inside the Friday, August 14 weekly expiration.
Implied volatility is the market's forecast for how far a stock will travel, baked into the option price. The expected move is what that forecast looks like in dollars, and it is close to what an at-the-money straddle costs. Every figure below comes off Monday morning's board.
Tuesday · August 11CoreWeave Prices A 13.6% Move
CoreWeave (NASDAQ: CRWV) reports after Tuesday's close. August 14 options carry 156.99% implied volatility and price a move of ±$12.29 against a $90.47 share price, about 13.6%. One week out that reading drops to 119.50%.
The next step down, August 21 to August 28, is only 11.7 points, and the curve flattens into the low 90s by late September and stays there. Current implied volatility sits at the 47th percentile of CoreWeave's 52-week range. TipRanks notes the stock has averaged a 16.76% absolute move on its last four reports, above what the board is pricing now.
Positioning is heavy but two-sided. Call open interest totals 1,220,347 contracts against 843,707 puts. Monday's flow leaned cautious underneath that: 21% of call volume printed at the bid or below against 13% at the ask, and 60% of put volume sat in 0 to 20 delta contracts, which reads as cheap downside cover rather than directional shorts.
TipRanks reports consensus at a loss of $1.22 per share on revenue rising about 111% to $2.55 billion. Analyst targets are scattered rather than clustered: Piper Sandler initiated Overweight at $151, Deutsche Bank's Brad Zelnick raised to $150, Wells Fargo's Michael Turrin sits at $155, and Barclays cut to $90 at Equal Weight. Consensus targets range from roughly $128 to $147 depending on which analyst set is counted.
BofA Securities analyst Tal Liani framed data center activation and power coming online as the variables that matter in a late-July preview note, with roughly 1 gigawatt active against a 1.7 gigawatt year-end target.
A meaningful acceleration in capacity deployment over the next few quarters.Tal Liani, BofA Securities, July 2026 preview note on CoreWeave's buildout pace
Where The Event Premium Sits
Each name against its own next expiration · Monday morning, August 10, 2026 · click any bar for detail
| Name | Reports | Aug 14 IV | Aug 21 IV | Aug 14 move | Aug 21 move |
|---|---|---|---|---|---|
| CRWV | Tue PM | 156.99% | 119.50% | 13.6% | 17.0% |
| NBIS | Wed AM | 167.41% | 138.91% | 14.5% | 19.8% |
| AMAT | Thu PM | 108.37% | 86.51% | 9.3% | 12.2% |
| CSCO | Wed PM | 95.65% | 65.85% | 8.2% | 9.3% |
Click a bar for detail. The August 14 expiration catches each company's report. August 21 catches none of them. The gap between the two is what the market charges for the event.
Source: intraday options data as of Monday morning, August 10, 2026. Expected moves measured against Monday morning share prices of $90.47 (CRWV), $191.30 (NBIS), $528.65 (AMAT) and $123.20 (CSCO). Figures are point in time.
Wednesday · August 12Three Events, One Session
Wednesday is the hinge of the week. July CPI releases at 8:30 a.m. ET, Nebius reports before the open, and Cisco reports after the close. Anyone holding either name through Wednesday is holding the macro print too.
Nebius (NASDAQ: NBIS) prices the largest percentage move of any of these reports, at 167.41% implied volatility and ±$27.75 on a $191.30 stock, about 14.5%. It falls to 138.91% the following week. TipRanks reports consensus revenue near $574 million, up more than 400% from a year ago, after a Reflection AI cloud agreement worth over $1 billion. Loss estimates are unusually scattered, running from roughly $0.53 to $0.86 per share depending on the source, which is its own signal about how little agreement there is on this quarter.
The analyst picture has split wide open going in. Piper Sandler's James Fish initiated at Neutral with a $224 target. DA Davidson's Gil Luria cut his target to $175 from $250. Michael Burry disclosed a short position. Monday's flow leaned the other way from all of that, with calls printing at the ask and put volume skewed toward the bid.
Cisco (NASDAQ: CSCO) carries the same Wednesday exposure in a much smaller number, and the number can mislead. The front week prices only ±$10.14, an 8.2% move, which looks modest until it is set against Cisco's own history: implied volatility sits at the 82nd percentile of its 52-week range, and the front week falls to 65.85% by August 21.
A small dollar move and a historically expensive option are not a contradiction. They measure different things, which is the distinction our guide to IV rank versus IV percentile exists to draw.
Cisco's tape leans call-heavy but is not one-way. Calls outran puts nearly two to one, call volume ran at more than four times its own typical pace, and 15% of it printed at the ask against 7% at the bid. The counterweight sits on the put side: 35% of put volume printed at the ask or above. Someone is paying up for downside here even as the call tape dominates the headline ratio.
Alphastreet reports consensus at $1.17 per share from 21 analysts on revenue of $16.83 billion, with a tight estimate range of $1.15 to $1.19. Management raised its fiscal-year AI infrastructure order outlook to $9 billion from $5 billion. UBS analyst David Vogt reiterated Buy with a $132 target, modeling EPS of $1.19 against the $1.17 consensus.
Thursday · August 13Applied Materials Sees Protection Bought Ahead Of The Print
Applied Materials (NASDAQ: AMAT) reports Thursday night, one session before expiration. The front week prices 108.37% implied volatility and a ±$49.35 move, roughly 9.3%, falling to 86.51% the week after.
The flow is where this board separates from its own norm. Puts ran at 1.34 times call volume, with 10% of put volume printing at the ask or above against 4% at the bid, and 71% of it sitting in 0 to 20 delta contracts. Delta approximates the odds an option finishes in the money, so a 0 to 20 delta put is a far out-of-the-money strike with a low probability of paying off, cheap per contract and typically bought as insurance rather than as a directional position.
The hedging sits on a stock that already corrected. Shares near $529 are down about 28% from a 52-week high of $739.67 set June 30. Consensus calls for $3.39 per share on revenue near $9 billion, inside management's guided range of $3.16 to $3.56 and $8.95 billion plus or minus $500 million. Targets are spread wide: Susquehanna's Mehdi Hosseini went to $900 from $575 back in late June, Wells Fargo sits at $740 at Overweight, and Morgan Stanley is at $646 at Equal Weight. MarketBeat puts the consensus near $603, though other trackers put it between $594 and $640.
Where Each Board Is Leaning
None of the below is a trade. It is what each board's own signal points toward, and the structures that tend to express that view.
- CRWV, neutral, with a caution. A front week priced well above the rest of the curve is the classic setup for premium selling into the event, which is what a short iron condor or another defined-risk neutral structure is built for. The caution is the history: the stock has averaged a 16.76% absolute move on its last four reports, more than the board is charging now. Selling this event is a bet that this print is quieter than the recent run.
- NBIS, bullish. The signal is the tape rather than the volatility level. Calls lifting the offer while put volume skews to the bid is a buyer-led call market, and traders who want to lean that way without paying elevated front-week premium tend to look at credit structures below the market such as a bull put spread. The offsetting risk is that it reports into CPI.
- CSCO, neutral to slightly bullish. For a holder already long and willing to part with shares higher, the front week pays more for that commitment than Cisco's own history usually allows, which is the covered call setup. The percentile says the premium is high by Cisco's standards, not that the market is wrong, and the 35% of put volume lifting the offer argues the downside is not as quiet as the call tape suggests.
- AMAT, hedged. The put flow points at protection rather than direction, and shareholders who share that instinct generally reach for something like a collar, financing downside cover by selling upside. Elevated call premium in the front week is what makes that financing work here.
Three Things To Watch This Week
The 8:30 print reprices before a single report is read. Nebius and Cisco both report on CPI day, so their front week carries macro risk that Tuesday's and Thursday's reports do not. That is the one exposure these names genuinely share.
A small expected move is not a cheap option. Cisco's 8.2% looks modest in dollars while sitting at the 82nd percentile of its own range. Those measure different things, and neither settles whether the premium is worth paying. The question is whether 8.2% is more or less than what Cisco actually tends to deliver on a print.
The headline ratio hides more than it shows. Applied Materials' 1.34 put-call ratio looks bearish until you see that 71% of it is in 0 to 20 delta contracts, which is hedging rather than a directional bet. Cisco runs a call-heavy ratio with 35% of its put volume lifting the offer. Our option chain explained guide covers reading volume and open interest together.
Sources: U.S. Bureau of Labor Statistics (CPI release schedule) · TipRanks (CRWV) · TipRanks (CRWV historical move) · Benzinga (BofA on CRWV) · TipRanks (NBIS) · Barchart (NBIS) · Alphastreet (CSCO) · TipRanks (CSCO options) · CNBC (AMAT quote data) · TipRanks (Susquehanna on AMAT) · MarketScreener (calendar)
Option pricing figures reflect intraday data as of Monday morning, August 10, 2026 and change throughout the session. Expected moves are derived from option prices before each report and are not forecasts of direction. Analyst estimates and price targets are attributed to their published sources and are subject to revision. This content is for informational and educational purposes only and is not a recommendation to buy or sell any security or to use any particular strategy. Options involve substantial risk and are not suitable for all investors. Please read Characteristics and Risks of Standardized Options before trading options.
FAQ
Implied volatility is forward-looking. It's what the market expects, backed out of an option's price. Historical volatility is backward-looking. It's what the stock actually did over a past window.
Your Weekly Options Edge
Get the options insights that matter most each week.
More from TradingBlock Now
Stay informed with the latest market insights
.png)