SpaceX Earnings: What Experts and Options Expect
SPCX posts its first results as a public company after Tuesday's close, two days before roughly 911.5 million locked-up shares come free. The August 7 expiration carries 234.37% implied volatility, and a single strike accounts for two thirds of its call open interest.


At a Glance
- The August 7 expiration carries 234.37% implied volatility and prices a move of ±$21.30, roughly 17.7%, against a $120.63 share price. That marks a range near $99 to $142 over three sessions.
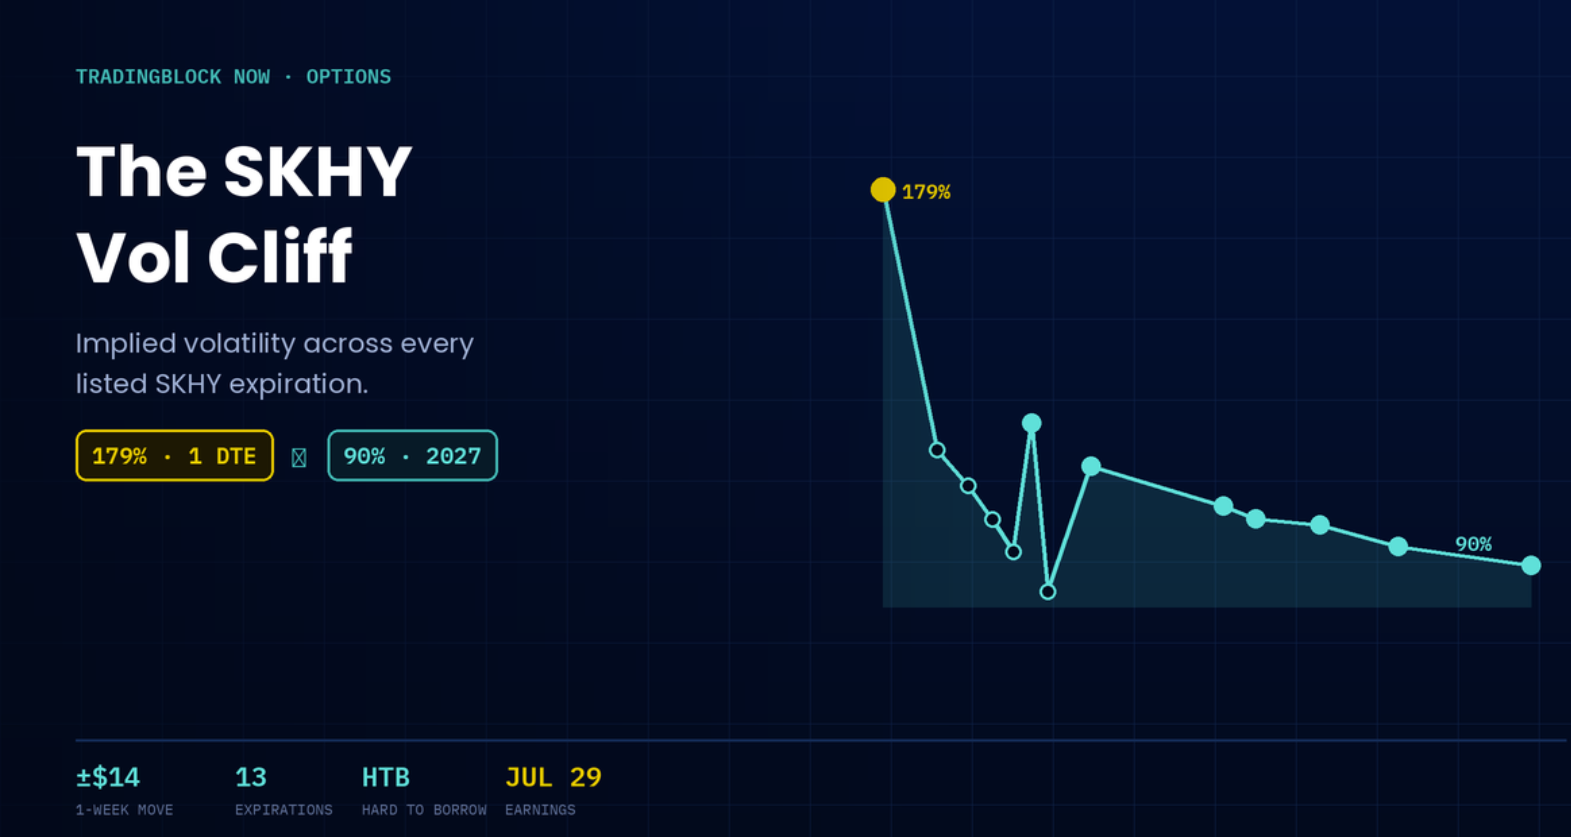
- Implied volatility drops to 159.35% one week later and 137.00% by August 21, settling near 71% at the December 2028 expiration.
- Put volume is running at 2.22 times its normal pace against 1.46 for calls, and 57% of it is trading at 0 to 20 delta.
- Roughly 911.5 million shares held by insiders and early investors become eligible for sale when the lock-up expires August 6. Shares are hard to borrow.
SpaceX (NASDAQ: SPCX) reports after Tuesday's close, its first quarterly disclosure since the June 12 debut. Shares traded near $120.63 Tuesday morning, up 5.3% on 44.4 million shares, with the August 7 weekly expiration carrying 234.37% implied volatility and pricing a move of ±$21.30 through Friday. That is an implied range of roughly $99 to $142, or 17.7%, over three trading sessions.
There Is No Volatility Percentile Yet
Most earnings previews anchor implied volatility against its own 52-week range. SPCX has traded publicly for seven weeks, so the 52-week implied volatility high, low and percentile all return no value, and the same is true for historical volatility. The usual IV rank and IV percentile comparison is unavailable, which removes the standard test for whether 234% is expensive relative to this specific stock.
The comparison that remains is cross-sectional. Reuters reports options traders priced a 6.6% move into Microsoft ahead of its report last week, and that SPCX options imply a swing of roughly $225 billion in the company's value. Aggregate implied volatility across all SPCX expirations sits at 117.01% against a VWAP of $118.55.
Wall Street Is Split on What the Company Is Worth
Consensus leaves limited room for surprise on the headline figures. Reuters reports analysts expect revenue of nearly $7 billion and a quarterly loss before interest and taxes of $1.55 billion. The variables carrying more weight are Starlink subscriber growth, launch cadence, capital spending on AI infrastructure, and any commentary on the path toward self-funding.
The valuation debate behind those numbers is unusually wide. Oppenheimer analyst Timothy Horan opened Wall Street's first coverage of the company with an outperform rating and a $190 target, expecting Starlink to carry near-term cash generation and the AI business to become the largest contributor over time.
We see it as the only vertically integrated AI company with the required capital, data, LLMs, hardware, manufacturing and engineering talent.Timothy Horan, Oppenheimer, June 11 initiation note
Morningstar reached a different number, valuing SpaceX at $780 billion in a pre-IPO assessment published in early June, citing uncertainty around the AI business. That figure came in at less than half the valuation the company was targeting at the time, and sits well under today's $1.5 trillion market capitalization. Shares reached an intraday high of $225.64 within days of the debut and closed Monday at $114.53, down about 43% from a closing peak of $201.80. The stock is flagged hard to borrow, and Reuters reports short sellers held an estimated $18.4 billion of mark-to-market gains as of the July 31 close.
The overall volatility level is massive.Ophir Gottlieb, CEO of Capital Market Laboratories, to Reuters
SPCX Implied Volatility and Expected Move by Expiration
Expected move in dollars (bars) and implied volatility (line) · Tuesday morning · August 4, 2026
| Expiration | Days | Implied vol | Expected move |
|---|---|---|---|
| 7 AUG 26 | 3 | 234.37% | ±$21.30 |
| 14 AUG 26 | 10 | 159.35% | ±$26.17 |
| 21 AUG 26 | 17 | 137.00% | ±$29.42 |
| 28 AUG 26 | 24 | 123.43% | ±$31.59 |
| 4 SEP 26 | 31 | 114.33% | ±$33.35 |
| 11 SEP 26 | 38 | 108.71% | ±$35.23 |
| 18 SEP 26 | 45 | 106.45% | ±$37.74 |
| 16 OCT 26 | 73 | 99.55% | ±$45.82 |
| 20 NOV 26 | 108 | 92.44% | ±$52.70 |
| 18 DEC 26 | 136 | 89.79% | ±$58.37 |
| 15 JAN 27 | 164 | 86.15% | ±$62.19 |
Source: intraday options data as of Tuesday morning, August 4, 2026. Implied volatility falls from 234.37% at the August 7 expiration to 137.00% by August 21 and 99.55% by October 16, continuing lower to 70.86% at the December 2028 expiration.
The Event Premium Sits Almost Entirely in the Front Week
The expected move is the swing, up or down, that option prices imply for a given expiration, and it runs close to what an at-the-money straddle costs. August 7 prices ±$21.30 at 234.37% implied volatility. One week later that falls to 159.35%, then 137.00% by August 21 and 123.43% by August 28. The curve keeps grinding lower and reaches 70.86% at the December 2028 expiration.
Two events sit inside that front week. Earnings arrive Tuesday night, and the first post-IPO lock-up expires August 6, clearing approximately 911.5 million shares held by insiders, employees and early investors for potential sale. Front-week contracts carrying this much event premium typically lose a large share of their value within minutes of the release regardless of which way the stock moves, a repricing covered in our guide to IV crush after earnings. For how a forecast like 234% compares against what a stock actually delivers, see implied versus realized volatility.
One Strike Distorts the Whole Call Board
August 7 open interest reads as overwhelmingly bullish at first pass. Call open interest totals 827,424 contracts against 268,778 puts, a ratio above three to one. That figure is misleading. The large majority of those calls sit at a single $330 strike, roughly 2.7 times the current share price, while the busiest strike anywhere near the money is the 130 call at 13,220 contracts. Set the $330 block aside and the two sides of the board are far closer to even.
Put open interest is distributed the way pre-earnings protection usually is, with the heaviest concentrations at $115 with 17,001 contracts, $110 with 16,090 and $105 with 14,828. Open interest alone does not establish direction, since covered calls, spreads and institutional hedges all contribute to the totals. Our option chain guide covers how open interest and volume should be read together.
Today's Flow Is Balanced in Size and Split by Strike
Tuesday's volume is close to even. Approximately 316,818 calls and 290,124 puts had traded by late morning, a put-call volume ratio of 0.916. Relative to their own norms the two sides are not equal, though: put volume is running at 2.22 times its typical pace against 1.46 for calls.
Where that volume sits tells the clearer story. Delta measures how much an option moves when the stock moves, and by extension how far from the money it sits. On the put side, 57% of volume is trading at 0 to 20 delta, cheap strikes that function as tail-risk insurance, and only 11% sits at 41 to 60 delta. Calls are distributed further up the curve, with 43% at 0 to 20 delta and 27% at 41 to 60.
Trade location adds one more note. Put volume printed at the bid or below 29% of the time against 23% at the ask or above, a tilt consistent with put selling into the elevated premium. Calls were closer to symmetric at 25% and 26%.
The skew runs against the prevailing bearish narrative. With shares near $120.80, the August 7 136 call sits about 15 points above the money at 235.59% implied volatility while the 105 put sits about 16 points below it at 220.78%. The gap widens further out: the 140 call carries 238.18% despite being the more distant strike. Upside calls are the richer side of this board. Interactive Brokers chief strategist Steve Sosnick told Reuters that traders are willing to speculate on a return toward the $135 IPO price. Reuters also reports the opposite read from positioning data.
The weight of the evidence is the options market is sort of leaning short the stock.Brent Kochuba, founder of SpotGamma, to Reuters
SPCX Option Volume by Delta Bucket
Share of Tuesday's total volume by moneyness · August 4, 2026
| Delta | Call volume | Share | Put volume | Share |
|---|---|---|---|---|
| 0 to 20 | 136,636 | 43% | 165,967 | 57% |
| 21 to 40 | 74,461 | 23% | 82,686 | 28% |
| 41 to 60 | 86,933 | 27% | 34,633 | 11% |
| 61 to 80 | 16,679 | 5% | 6,707 | 2% |
| 81 to 100 | 2,109 | 0% | 131 | 0% |
| Total | 316,818 | 290,124 |
Source: intraday options data as of Tuesday morning, August 4, 2026. Put-call volume ratio 0.916. Put sizzle index 2.222 against 1.46 for calls.
Four Structures That Fit the Data
Four structures from our option strategies library, chosen for this board rather than offered as recommendations. Two constraints drove the picks. A binary event with a lock-up two days behind it argues for defined risk, which rules out naked shorts in the front week. And at 234% implied volatility the premium is the deciding input, so three of the four collect it. A long straddle would cost roughly what the expected move is worth, needing SPCX above $142 or below $99 just to break even.
Strikes reference the August 7 expiration and its ±$21.30 expected move. Prices are Tuesday morning midpoints and will move into the report. Every structure includes a short option, and a short option that finishes in the money can be assigned. Our guide to the option greeks covers how delta approximates the odds an option finishes in the money.
- Bull put spread · neutral to bullish. Chosen on flow: 57% of put volume is trading at 0 to 20 delta and printing at the bid, so the demand is for cheap tails and the 29 delta put is the richer sale. Sell the 110 put near $5.15, buy the 105 put near $3.38. Collects about $1.78 on a $5 wide spread, so $178 in against $322 at risk, breakeven near $108.22, and the board puts the 110 put about 63% to expire out of the money.
- Bear call spread · neutral to bearish. Chosen on skew: the 140 call carries 238.18% implied volatility against 220.78% on the 105 put, making calls the richer side to sell. Sell the 135 call near $5.45, buy the 140 call near $4.35. Collects about $1.10 on $5 wide, $110 in against $390 at risk, with the 135 call about 73% to expire out of the money. The thin credit is the tell that call premium stays elevated far above the money.
- Short iron condor · neutral. Chosen on the term structure: 234% front-week implied volatility against 159% one week out is the premium this trade is selling. It is the two spreads above held together. Sell the 110 put and 135 call, buy the 105 put and 140 call, collecting about $2.88 on $5 wings, $288 in against $212 at risk. The catch is probability, since the board puts SPCX inside the 110 to 135 window only about 37% of the time. Widening the shorts raises those odds and lowers the credit.
- Collar · neutral to bullish, for holders. Chosen on the same skew, which here lets the call more than pay for the put. Against 100 shares, buy the 105 put near $3.38 and sell the 140 call near $4.35 for a net credit of about $0.97. Floor at 105, cap at 140, net delta drops from 100 to roughly 49.
One structure worth noting sits outside this list because it needs a second expiration to price. The calendar spread sells the August 7 contract at 234.37% implied volatility and buys the same strike in August 14 at 159.35%, which is the most direct expression of the 75 point gap between the two. It also carries the risk that a large move leaves both legs far from the strike.
What Sets the Reaction
The release is one input among several. Guidance on Starlink subscriber growth, launch demand, capital spending on AI infrastructure, and any management commentary on the August 6 lock-up will each move the front-week board. Some holders have already found hedging impractical at these levels. Ascentis Asset Management chief investment officer Clint Sorenson told Reuters his firm dropped a planned synthetic hedge because the cost had risen beyond what clients would accept.
The remaining question is whether the realized move exceeds the ±$21.30 embedded in August 7 premiums. If it falls short, front-week options lose value quickly regardless of direction, and the traders selling into 234% implied volatility keep the difference. If it exceeds that range, the buyers will have paid a fair price for one of the least predictable events on the calendar.
Source: intraday options data as of Tuesday morning, August 4, 2026. Market data and analyst commentary from Reuters, Oppenheimer and Morningstar as linked above. Figures are point in time and change throughout the session. This content is for informational and educational purposes only and is not a recommendation to buy or sell any security or to use any particular strategy. Options involve substantial risk and are not suitable for all investors. Please read Characteristics and Risks of Standardized Options before trading options.
FAQ
Implied volatility (IV) is the market's expectation of how much a stock may move in the future, derived from option prices. It forecasts the size of the move, not the direction.
Your Weekly Options Edge
Get the options insights that matter most each week.
More from TradingBlock Now
Stay informed with the latest market insights