Option Market Pricing Only 1% Move Ahead of Midterms
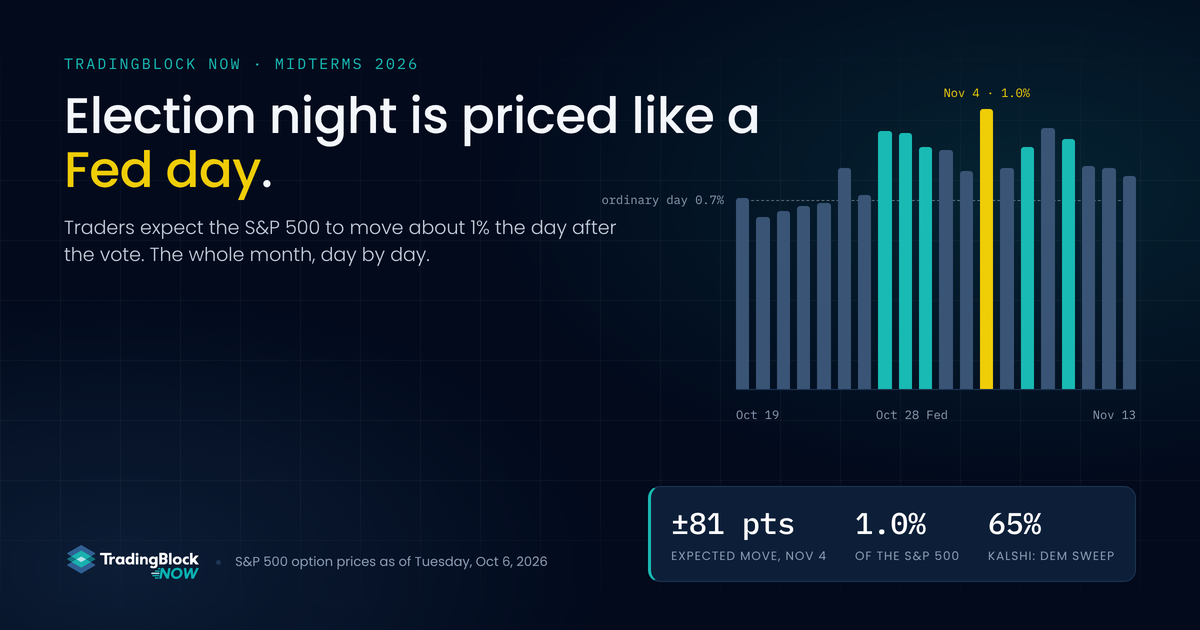
Traders who bet on market swings expect the S&P 500 to move about 1% the day after the midterms. That is the same move they expect from the Fed meeting a week earlier. The betting markets help explain why.

At a Glance
- ±81 SPX points for Nov 4, the day after the vote: about 1% either way, the biggest single-day move priced through mid-November, slightly more than the Oct 28 Fed decision.
- Betting markets see a flip: Kalshi has a Democratic sweep at 65% and better than 90% odds that at least one chamber changes hands.
- History is a bit messy - the last two midterms moved the S&P 500 about 2% the next day; the three before that, 0.6% or less.
The US midterms are four weeks out, and the market doesn't seem to care.
I spent a long time this week pulling apart options data to find out what traders are pricing in for election night. The answer is not much. The options market expects the S&P 500 to move about 1% the day after the vote. That is the same move it expects from a routine Fed meeting.
That surprised me. The political environment feels more charged than it did going into the last midterms, yet the market is paying far less to protect itself. In the weeks before the 2022 vote, the VIX, Wall Street's fear gauge, sat in the mid-to-high 20s. Today it is near 15. Personally, I think options are cheap here, given how the last two midterms went and how much else lands in the same three weeks. Here is what I found, day by day.
How I Measured It
Options are contracts whose value depends on how far the market moves, and in which direction. The more movement traders expect, the more they cost, the same way flood insurance costs more in a flood zone. So option prices are a running vote on how much the market will move, and by when.
Options on the S&P 500 expire every trading day. The ones that expire on Election Day stop trading before any results are in. The ones that expire the next day live through the count. Each set of prices tells you how much total movement traders expect by that date. Whatever extra movement the day-after contracts build in, beyond what the Election Day contracts build in, belongs to the results. On Tuesday I measured that at about 81 points, or 1%. The market lands inside a move that size about two days out of three. The 0.8% figure you may have seen from the big banks is the same data measured with a slightly different yardstick.
Six Events in Two Weeks
I ran the same comparison for every day and got a calendar. Before Oct 26, traders expect an ordinary day to move about 0.7%. Then the expected moves step up.
| Day | What happens | Expected move |
|---|---|---|
| Oct 28 | Fed decision | 0.96% |
| Oct 29 | Microsoft and Meta report earnings the evening before (expected); Alphabet reports the same week, date unconfirmed | 0.95% |
| Oct 30 | Apple and Amazon report the evening before (expected) | 0.90% |
| Nov 3 | Election Day, polls still open when the market closes | 0.81% |
| Nov 4 | The day after the vote | 1.04% |
| Nov 6 | October jobs report | 0.90% |
| Nov 10 | October inflation report (CPI) | 0.93% |
Election week as a whole is priced for a 2.0% move. The Fed and earnings week before it, 1.96%. The week after, 1.95%. An ordinary October week, 1.5%. Traders have marked up three full weeks, with election night one bump among several.
How much the market is expected to move each day
Expected S&P 500 move for each trading day, Oct 19 to Nov 13 · Tuesday, Oct 6, 2026 · click any bar for detail
| Day | Event | Points | Percent |
|---|---|---|---|
| Oct 19 | 55.8 | 0.71% | |
| Oct 20 | 49.6 | 0.64% | |
| Oct 21 | 51.8 | 0.66% | |
| Oct 22 | 53.2 | 0.68% | |
| Oct 23 | 54.2 | 0.69% | |
| Oct 26 | 64.1 | 0.82% | |
| Oct 27 | 56.4 | 0.72% | |
| Oct 28 | Fed decision | 75.3 | 0.96% |
| Oct 29 | Microsoft, Meta earnings (expected) | 74.0 | 0.95% |
| Oct 30 | Apple, Amazon earnings (expected) | 70.5 | 0.90% |
| Nov 2 | 69.9 | 0.89% | |
| Nov 3 | Election Day, polls still open | 63.2 | 0.81% |
| Nov 4 | Day after the vote | 81.1 | 1.04% |
| Nov 5 | 64.1 | 0.82% | |
| Nov 6 | October jobs report | 70.5 | 0.90% |
| Nov 9 | 76.1 | 0.97% | |
| Nov 10 | October inflation report | 72.9 | 0.93% |
| Nov 11 | 64.6 | 0.83% | |
| Nov 12 | 64.4 | 0.82% | |
| Nov 13 | 62.1 | 0.79% |
Click a bar for detail. The dashed line is an ordinary day, about 0.7%. Everything from Oct 28 on is priced above it.
Source: S&P 500 option prices, Tuesday, Oct 6, 2026, index near 7,815. Each bar is the extra movement built into the options expiring that day beyond the options expiring the day before, converted to points and percent (difference in implied variance between consecutive expirations; the Nov 3 contracts priced a move of about 255 points, the Nov 4 contracts about 267). Earnings dates are the companies' expected dates. Figures are point in time.
What the Betting Markets Say
Kalshi lets people bet real money on election outcomes, and more than $30 million has been wagered on who controls Congress. As of Tuesday the odds were 65% that Democrats win both chambers, 28% that they win the House while Republicans keep the Senate, 8.6% that Republicans keep both, and 1% for the reverse split. Polymarket, the other big betting site, is within a couple of points on every line. Kalshi prices the no-change outcome, Republicans keeping both, at 8.6%. The three outcomes in which at least one chamber flips add up to about 94% at displayed prices. The two figures don't meet at 100 because each outcome trades as its own contract with its own spread. Either way, the market puts a flip somewhere above 90%.
That may help explain the quiet pricing. Options pay for surprise. When one broad outcome is better than a 90% favorite, there is less surprise left to pay for. What traders are still paying for is the Senate, which Kalshi puts at 63% Democratic, the size of the House margin, and the chance of a slow count. In 2022 it took more than a week to call the House.
The timing lines up too. The odds of a Democratic sweep sat near 50% through August and jumped above 60% in late September. Over the same weeks, the expected move for election night shrank. The two moved together over the same weeks, which fits the story without proving it.
Who will control Congress? The betting markets' odds
Odds for each outcome after Nov 3 · Kalshi as of Oct 6, Polymarket as of Oct 3 · click any bar for detail
| Outcome | Kalshi | Polymarket |
|---|---|---|
| Democrats win both chambers | 65% | 65% |
| Democratic House, Republican Senate | 28% | 29% |
| Republicans keep both | 8.6% | 6.5% |
| Republican House, Democratic Senate | 1% | 0.6% |
Click a bar for detail. The no-change line, Republicans keeping both, trades at 8.6%. The three flip outcomes add up to about 94%. Either way, better than 90% odds that at least one chamber changes hands.
Source: Kalshi, Midterms: Congress Balance of Power, as of Tuesday, Oct 6, 2026, $30.6 million wagered. Polymarket as of Oct 3, 2026. Figures are shown as Kalshi displays them and can add to slightly more than 100% because each outcome trades as a separate contract. Odds move continuously.
Fear Is Cheap Right Now
Traders are paying a little more to protect against a drop than to bet on a rally. That is normal for the stock market, and the tilt is only slightly bigger than usual going into the vote. Overall, the cost of protecting a portfolio sits near the low end of the past year.
The VIX, often called Wall Street's fear gauge, is near 15, which is low. Bets on where it will be in late October and mid-November point to 17 or 18. That is the gauge's normal resting shape, with no spike around the election. The option prices put the odds of the fear gauge topping 20 by Oct 21 at under one in ten. The one sign of nerves: on Tuesday a lot of cheap VIX bets changed hands, the kind that only pay if something goes badly wrong.
What Happened the Last Five Times
- 2022: The S&P 500 fell 2.1% the day after the vote. Control of the House was still up in the air and a big inflation report was due the next morning.
- 2018: Up 2.1%, the best day after a midterm since 1982. Voters split Congress, as expected, and the market treated it as a relief.
- 2014: Up about 0.6%.
- 2010: Up about 0.4%, helped by a Fed stimulus announcement the same day.
- 2006: Up about 0.2%.
The day after the last five midterms, next to what traders expect this time
S&P 500 move on the first trading day after each vote · shaded band is the 2026 expected range · click any bar for detail
| Year | Next-day move |
|---|---|
| 2006 | +0.2% |
| 2010 | +0.4% |
| 2014 | +0.6% |
| 2018 | +2.1% |
| 2022 | -2.1% |
Click a bar for detail. Two of the last five midterms moved the market double what options price today. The other three barely moved it.
2022 and 2018 from closing prices as reported. 2014, 2010 and 2006 rounded to the nearest tenth. 2026 range from S&P 500 option prices, Oct 6, 2026.
Two of the last five midterms moved the market twice as much as traders expect this time. The other three barely moved it. Average them and you land close to today's pricing. Options price a range of likely outcomes, not a prediction. The actual move can land well inside that range or blow through it, and the last five midterms did both.
The weeks before the vote have their own history. Cantor Fitzgerald counted 15 midterm years out of 24 since 1930 in which the S&P 500 dropped 5% or more during September and October. This year stocks are near a record and the fear gauge is near its lows. If history holds, the bigger risk is the run-up. Fear tends to build into the vote more than it spikes the night after.
Sources: S&P 500 and VIX option prices, Tuesday, Oct 6, 2026 · Bloomberg, “Options Are Pricing In Muted Moves for US Stocks on Midterm Vote,” Sept 28, 2026 (JPMorgan estimate and VIX history) · Barclays estimate of the Nov 4 move, reported Oct 1, 2026 · Reuters, “Fearless US stock market vulnerable to shocks as midterms loom,” Sept 9, 2026 (Cantor Fitzgerald figures) · Kalshi, Congress Balance of Power, as of Oct 6, 2026 · Polymarket balance-of-power odds, as of Oct 3, 2026 · Bureau of Labor Statistics release calendar. Earnings dates are company expected and subject to change.
Options involve risk and are not suitable for all investors. Prior to trading options, you must receive a copy of Characteristics and Risks of Standardized Options. Nothing here is a recommendation to buy or sell any security or to adopt any trading strategy. Example structures are for educational purposes only, use prices from a point in time during the session, and will change. Multi-leg strategies involve multiple commissions and assignment risk. Past performance does not guarantee future results.
FAQ
Implied volatility (IV) is the market's expectation of how much a stock may move in the future, derived from option prices. It forecasts the size of the move, not the direction.
Your Weekly Options Edge
Get the options insights that matter most each week.
More from TradingBlock Now
Stay informed with the latest market insights